January 23, 2026 a 11:31 am

📊 GEN: Dividend Analysis - Gen Digital Inc.
Gen Digital Inc., a leader in its sector, presents a unique dividend profile characterized by a moderate yield and a decade-long distribution history. Despite recent turmoils, including a dividend cut in 2021, its financial metrics provide insight into a stable cash flow supporting future payouts. Investors may find its consistent dividend approach favorable, though past growth stumbles should be considered in an evaluative context.
Overview
🗣️ The sector represents the business context and competitive environment within which Gen Digital operates, impacting its dividend policies.
| Sector | Details |
|---|---|
| Sector | Technology |
| Dividend yield | 1.91 % |
| Current dividend per share | 0.51 USD |
| Dividend history | 13 years |
| Last cut or suspension | 2021 |
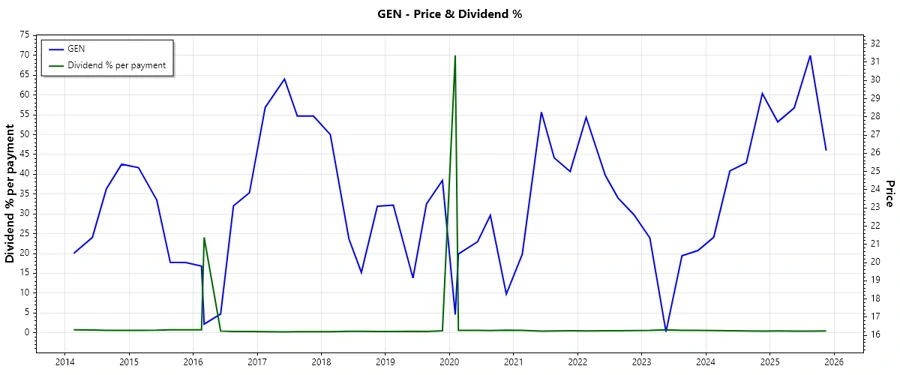
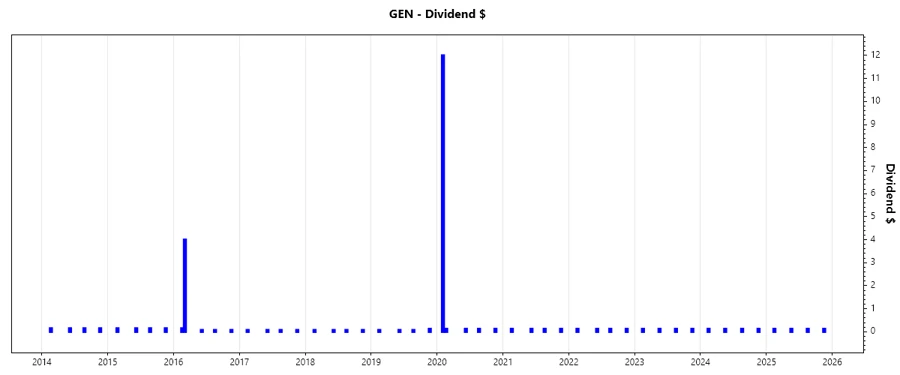
Dividend History
📈 The dividend history provides insight into Gen Digital's past distribution reliability, essential for forecasting future dividend stability.
| Year | Dividend Per Share (USD) |
|---|---|
| 2025 | 0.500 |
| 2024 | 0.500 |
| 2023 | 0.500 |
| 2022 | 0.500 |
| 2021 | 0.500 |
Dividend Growth
📈 Dividend growth reflects the company's ability to increase shareholder payments over time, a crucial indicator of financial health.
| Time | Growth |
|---|---|
| 3 years | 0 % |
| 5 years | -0.47 % |
The average dividend growth is -0.47 % over 5 years. This shows moderate challenges in maintaining dividend increases.
Payout Ratio
✅ Payout ratios are critical in assessing the sustainability of dividend payments relative to the company’s earnings and cash flows.
| Key Figure Ratio | Value |
|---|---|
| EPS-based | 54.91 % |
| Free cash flow-based | 24.07 % |
The 54.91 % EPS payout ratio indicates a balance that suggests responsible dividend distributions without overextending earnings commitment.
Cashflow & Capital Efficiency
🗣️ Efficient capital allocation and robust cash flows are indicators of a company's operational performance and ability to fund dividends.
| Metric | 2023 | 2024 | 2025 |
|---|---|---|---|
| Free Cash Flow Yield | 7.13% | 14.38% | 7.40% |
| Earnings Yield | 12.66% | 4.27% | 3.94% |
| CAPEX to Operating Cash Flow | 0.79% | 0.97% | 1.23% |
| Stock-based Compensation to Revenue | 4.04% | 3.63% | 3.41% |
| Free Cash Flow / Operating Cash Flow Ratio | 99.21% | 99.03% | 98.77% |
The sustained free cash flow yield is a positive indicator of the company’s ability to cover dividend payments without additional financial strain.
Balance Sheet & Leverage Analysis
⚠️ Analyzing balance sheet metrics and leverage ratios is essential for understanding the financial structure and debt management.
| Metric | 2023 | 2024 | 2025 |
|---|---|---|---|
| Debt-to-Equity | 4.46 | 4.04 | 3.66 |
| Debt-to-Assets | 61.57% | 54.80% | 53.66% |
| Debt-to-Capital | 81.70% | 80.18% | 78.56% |
| Net Debt to EBITDA | 5.99 | 4.88 | 3.61 |
| Current Ratio | 0.43 | 0.50 | 0.51 |
| Quick Ratio | 0.43 | 0.50 | 0.51 |
| Financial Leverage | 7.25 | 7.38 | 6.83 |
The decreasing debt-to-equity ratio over the years suggests improving leverage, which can mitigate risks associated with high indebtedness.
Fundamental Strength & Profitability
✅ Assessing fundamental strength and profitability metrics such as returns on equity and asset margins highlights operational efficiency.
| Metric | 2023 | 2024 | 2025 |
|---|---|---|---|
| Return on Equity | 60.64% | 28.36% | 28.34% |
| Return on Assets | 8.37% | 3.84% | 4.15% |
| Margins: Net | 40.22% | 15.97% | 16.34% |
| EBIT | 35.69% | 29.37% | 40.84% |
| EBITDA | 45.61% | 42.13% | 51.49% |
| Gross | 82.24% | 80.76% | 80.28% |
| Research & Development to Revenue | 9.44% | 8.74% | 8.36% |
The stable high return on equity indicates robust operational efficiency and profitability, providing a strong base for shareholder returns.
Price Development
Dividend Scoring System
| Category | Score | Score Bar |
|---|---|---|
| Dividend yield | 3 | |
| Dividend Stability | 4 | |
| Dividend growth | 2 | |
| Payout ratio | 3 | |
| Financial stability | 3 | |
| Dividend continuity | 4 | |
| Cashflow Coverage | 4 | |
| Balance Sheet Quality | 3 |
Overall Score: 26/40
Rating
In conclusion, Gen Digital Inc. presents a solid dividend offering with stable distributions and moderate growth potential. Although faced with past challenges, the payout ratio and balance sheet improvements provide optimism. It is recommended for investors seeking reliable income with a watchful eye on growth prospects.