December 29, 2025 a 07:46 am

GEN: Dividend Analysis - Gen Digital Inc.
Gen Digital Inc. offers a compelling dividend profile marked by consistency and gradual growth. The stability of dividend payouts over the past years underscores management’s commitment to returning value to shareholders. Investors should be mindful of the company's recent strategic financial shifts, such as its last dividend cut in 2021, which highlight its adaptive approach in response to market dynamics.
📊 Overview
The fundamental analysis of Gen Digital Inc. showcases a well-rounded financial stature, especially within the technology sector. The company's moderate dividend yield of 1.91% aligns with its strategic growth plans, with solid backing from a 13-year dividend history.
| Factor | Detail |
|---|---|
| Sector | Technology |
| Dividend yield | 1.91% |
| Current dividend per share | 0.51 USD |
| Dividend history | 13 years |
| Last cut or suspension | 2021 |
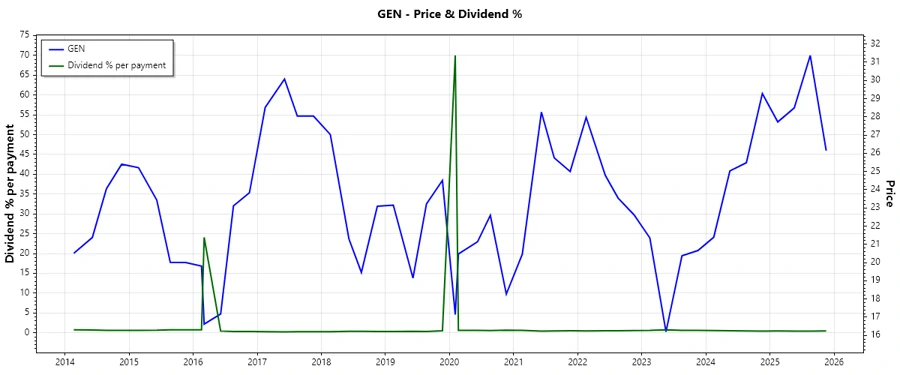
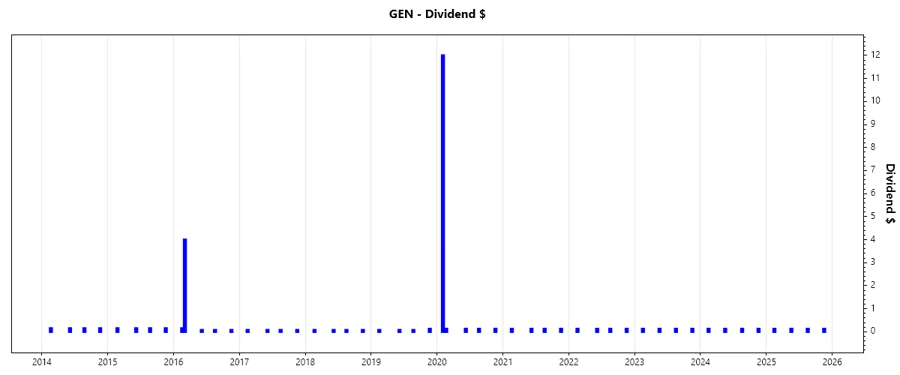
📈 Dividend History
Gen Digital has proven its resilience by maintaining consistent dividend payouts, an indicator of robust cash flow management critical for investor confidence.
| Year | Dividend per Share (USD) |
|---|---|
| 2025 | 0.50 |
| 2024 | 0.50 |
| 2023 | 0.50 |
| 2022 | 0.50 |
| 2021 | 0.50 |
🗣️ Dividend Growth
The dividend growth trajectory for Gen Digital provides insights into its forward-looking financial strategies and operational efficiencies, with important implications for long-term investors.
| Time | Growth |
|---|---|
| 3 years | 0% |
| 5 years | 7.39% |
The average dividend growth is 7.39% over 5 years. This shows moderate but steady dividend growth.
✅ Payout Ratio
Understanding the payout ratio sheds light on the sustainability of Gen Digital's dividend policy, which determines the proportion of earnings and free cash flow distributed as dividends.
| Key figure | Ratio |
|---|---|
| EPS-based | 54.91% |
| Free cash flow-based | 24.06% |
The EPS payout ratio of 54.91% signifies a straightforward, reliable dividend distribution policy, while the FCF payout ratio at 24.06% demonstrates prudent cash flow allocation.
📈 Cashflow & Capital Efficiency
Efficient cash flow management is fundamental for sustaining both operational needs and strategic growth, reflected in the company’s comprehensive capital utilization metrics.
| KPI | 2025 | 2024 | 2023 |
|---|---|---|---|
| Free Cash Flow Yield | 7.40% | 14.38% | 7.13% |
| Earnings Yield | 3.94% | 4.27% | 12.80% |
| CAPEX to Operating Cash Flow | 1.23% | 0.97% | 0.79% |
| Stock-based Compensation to Revenue | 3.40% | 3.63% | 4.04% |
| Free Cash Flow / Operating Cash Flow Ratio | 98.77% | 99.03% | 99.21% |
| Return on Invested Capital | 7.76% | 11.37% | 15.38% |
The solid FCF yield reinforces Gen Digital's capability in translating sales into tangible cash flows, an essential factor in long-term investment assessments.
📉 Balance Sheet & Leverage Analysis
Evaluating leverage ratios and debt positions reveals critical insights into Gen Digital's financial resilience and its strategic debt management practices.
| Ratio | 2025 | 2024 | 2023 |
|---|---|---|---|
| Debt-to-Equity | 3.66 | 4.04 | 4.46 |
| Debt-to-Assets | 53.66% | 54.80% | 61.57% |
| Debt-to-Capital | 78.56% | 80.18% | 81.70% |
| Net Debt to EBITDA | 3.61 | 4.88 | 5.82 |
| Current Ratio | 0.51 | 0.50 | 0.43 |
| Quick Ratio | 0.51 | 0.50 | 0.43 |
| Financial Leverage | 6.83 | 7.38 | 7.25 |
While high, the company's debt ratios are carefully monitored, potentially raising red flags about liquidity under more challenging economic conditions.
✅ Fundamental Strength & Profitability
Gen Digital’s profitability ratios are an essential measure of its operational efficacy, guiding future investments and ensuring competitiveness.
| Metric | 2025 | 2024 | 2023 |
|---|---|---|---|
| Return on Equity | 28.34% | 28.36% | 61.32% |
| Return on Assets | 4.15% | 3.84% | 8.46% |
| Net Margin | 16.34% | 15.97% | 40.67% |
| EBIT Margin | 40.84% | 29.37% | 36.33% |
| EBITDA Margin | 51.49% | 42.13% | 46.94% |
| Gross Margin | 80.28% | 80.76% | 82.24% |
| R&D to Revenue | 8.36% | 8.74% | 9.44% |
These metrics signal strong profitability, demonstrating Gen Digital’s capability to convert revenue into substantial profit margins and returns on investments.
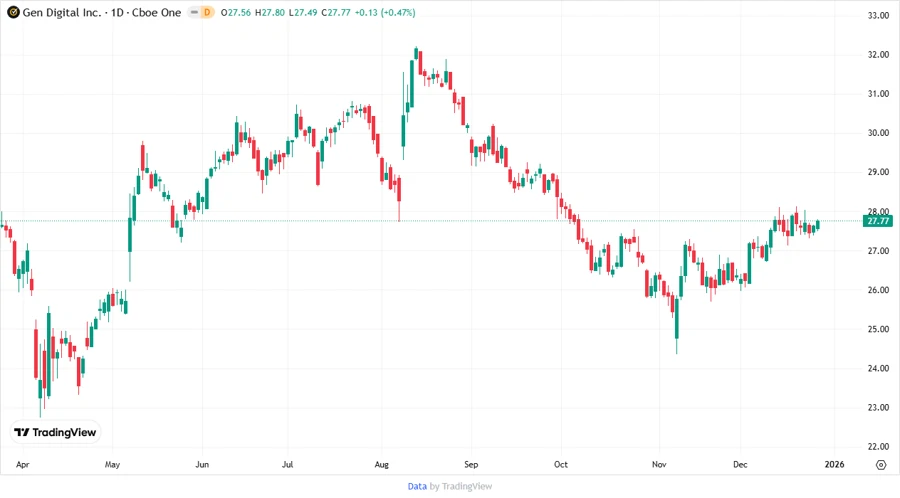
📈 Price Development
✅ Dividend Scoring System
| Criteria | Score | Score Bar |
|---|---|---|
| Dividend yield | 3 | |
| Dividend Stability | 4 | |
| Dividend growth | 3 | |
| Payout ratio | 4 | |
| Financial stability | 3 | |
| Dividend continuity | 4 | |
| Cashflow Coverage | 4 | |
| Balance Sheet Quality | 3 |
Total Score: 28/40
🗣️ Rating
Gen Digital Inc. is a robust investment opportunity for dividend-seeking investors, offering consistent returns supported by prudent financial management. While past dividend reductions suggest caution, the company's sound payout ratios and sustained profitability hint at a continued capacity to furnish shareholder value. Accordingly, an evaluation suggests a "Hold" rating with eyes on strategic improvements in leverage and operational efficiencies.