November 22, 2025 a 11:31 am


📊 Dividend Analysis - Gen Digital Inc.
Gen Digital Inc. demonstrates a strong commitment to dividend payments with a steady history of 13 years. The company provides a moderate dividend yield of approximately 1.91%, positioning itself as a viable option for income-focused investors amidst fluctuating market conditions. Stability in payouts, despite past adjustments in 2021, highlights resilience in operational cash flows.
📈 Overview
Gen Digital Inc. is situated within a sector characterized by reliable cash flow generation, crucial for sustaining its dividend payments. With a current dividend yield of 1.91% and a dividend per share of $0.51, it upholds a consistent distribution pattern over 13 years. Despite a cut in 2021, the company exhibits a resilient comeback in its dividend strategy.
| Metric | Details |
|---|---|
| Sector | Technology |
| Dividend yield | 1.91% |
| Current dividend per share | 0.51 USD |
| Dividend history | 13 years |
| Last cut or suspension | 2021 |
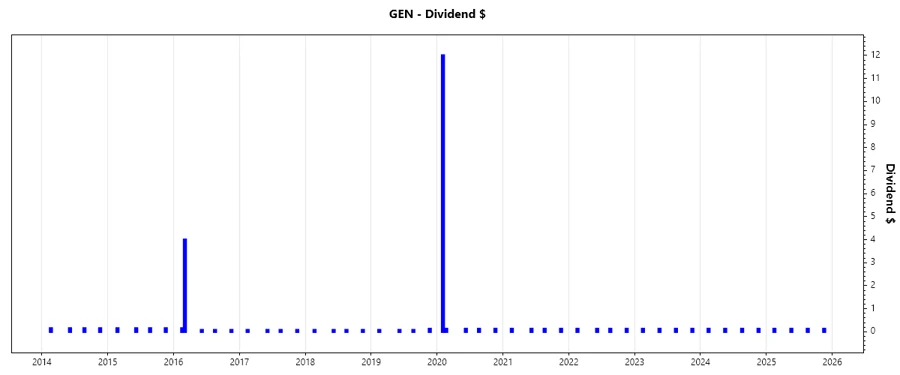
📉 Dividend History
The last five years have evidenced consistency in Gen Digital’s dividend distributions, reflecting the company's managerial commitment to returning value to shareholders. A detailed examination of the historical payments reveals stability, crucial for investor confidence amidst economic fluctuations.
| Year | Dividend Per Share (USD) |
|---|---|
| 2025 | 0.50 |
| 2024 | 0.50 |
| 2023 | 0.50 |
| 2022 | 0.50 |
| 2021 | 0.50 |
📈 Dividend Growth
Examination of the dividend growth shows negligible growth over the last three years. However, a modest growth rate of 0.07% over five years indicates a cautious approach in exploring growth opportunities that align with shareholder interests.
| Timeframe | Growth |
|---|---|
| 3 years | 0% |
| 5 years | 0.07% |
The average dividend growth is 0.07% over 5 years. This shows moderate but steady dividend growth.
✅ Payout Ratio
Gen Digital maintains a sustainable payout ratio, indicating prudence in balancing dividends with earnings. The EPS-based payout ratio stands at 54.91%, and Free Cash Flow (FCF)-based payout ratio is 24.06%. These metrics suggest a well-managed capital allocation that ensures sufficient retained earnings for reinvestment.
| Key Figure | Ratio |
|---|---|
| EPS-based | 54.91% |
| Free cash flow-based | 24.06% |
The EPS payout ratio of 54.91% reflects a balanced approach to distribute a portion of profits to shareholders while retaining flexibility for future growth. Similarly, the FCF payout ratio of 24.06% signifies effective cash flow usage in dividend payments.
💰 Cashflow & Capital Efficiency
Evaluating cashflow and capital efficiency, Gen Digital portrays robust metrics, reinforcing its capacity to generate consistent cash flows from operations. Over recent years, this has bolstered its dividend payment and reinvestment capabilities.
| Metric | 2025 | 2024 | 2023 |
|---|---|---|---|
| Free Cash Flow Yield | 7.40% | 14.38% | 7.13% |
| Earnings Yield | 3.94% | 4.27% | 12.80% |
| CAPEX to Operating Cash Flow | 1.23% | 0.97% | 0.79% |
| Stock-based Compensation to Revenue | 3.41% | 3.63% | 4.04% |
| Free Cash Flow / Operating Cash Flow Ratio | 98.77% | 99.03% | 99.21% |
The cash flow metrics suggest that the company is managing its cash efficiently, maintaining a low dependency on external liquidity sources, which is favorable for dividend policy sustainability and corporate growth prospects.
🔗 Balance Sheet & Leverage Analysis
Analyzing the leverage, Gen Digital is found to have substantial debt levels highlighted by its Debt-to-Equity ratio of over 3.6, indicating a high reliance on debt financing. Monitoring these ratios is critical in times of market volatility.
| Metric | 2025 | 2024 | 2023 |
|---|---|---|---|
| Debt-to-Equity | 3.66 | 4.04 | 4.46 |
| Debt-to-Assets | 53.66% | 54.80% | 61.57% |
| Debt-to-Capital | 78.56% | 80.18% | 81.70% |
| Net Debt to EBITDA | 3.61 | 4.88 | 5.82 |
| Current Ratio | 0.51 | 0.50 | 0.43 |
| Quick Ratio | 0.51 | 0.50 | 0.43 |
| Financial Leverage | 6.83 | 7.38 | 7.25 |
These ratios highlight a significant leverage strategy, potentially elevating risk levels. The company's emphasis on debt utilization raises alarms that necessitate keen monitoring.
💪 Fundamental Strength & Profitability
Strong fundamentals are evident in Gen Digital's profitability ratios, which reflect efficient operation and strategic exploitation of assets.
| Metric | 2025 | 2024 | 2023 |
|---|---|---|---|
| Return on Equity | 28.34% | 28.36% | 61.32% |
| Return on Assets | 4.15% | 3.84% | 8.46% |
| Net Margin | 16.34% | 15.97% | 40.67% |
| EBIT Margin | 40.84% | 29.37% | 36.33% |
| EBITDA Margin | 51.49% | 42.13% | 46.94% |
| Gross Margin | 80.28% | 80.76% | 82.24% |
| R&D to Revenue | 8.36% | 8.74% | 9.44% |
Return metrics such as ROE and ROA indicate superior efficiency in generating returns from equity and assets. Profit margins remain resilient, demonstrating the company’s strong competitive positioning.
🌟 Dividend Scoring System
| Category | Score | |
|---|---|---|
| Dividend yield | 3 | |
| Dividend Stability | 4 | |
| Dividend growth | 2 | |
| Payout ratio | 4 | |
| Financial stability | 3 | |
| Dividend continuity | 4 | |
| Cashflow Coverage | 3 | |
| Balance Sheet Quality | 2 |
Overall Score: 25/40
🗣️ Rating
Gen Digital Inc.'s dividend profile reflects a steady and reliable income source for investors, tempered by modest growth prospects. The company's efficiency in cash flow management positions it well within the market, but high leverage ratios warrant caution. Continuous dividend distribution amidst economic changes serves as a credible indicator of company resilience, deserving a moderate buy recommendation for conservative portfolios seeking regular income with controlled risk exposure.
Smart Data Insight
Master the Perfect Entry & Exit for this Stock
Don't leave your profits to chance. Historically, this stock follows specific seasonal patterns that institutional traders use to maximize returns.
- ✅ Identify the "Golden Buying Window"
- ✅ Avoid high-risk correction cycles
- ✅ Backtested data from the last 20+ years