November 06, 2025 a 11:31 am

GEN: Dividend Analysis - Gen Digital Inc.
Gen Digital Inc. exhibits a promising dividend profile with a modest yield of 1.59%. While the dividend growth rate has shown a plateau over the recent years, the company’s consistent dividend history over the past 13 years underscores solid stability. Despite a relatively high payout ratio, Gen Digital Inc.’s solid cash flow figures provide reassurance for sustained dividend payments in the future.
📊 Overview
Gen Digital Inc., operating in a highly competitive sector, presents an enticing dividend yield of 1.59%. This yield, coupled with a current dividend per share of 0.507, signifies a consistent return to shareholders. With 13 years of dividend history, the firm's track record remains untarnished by any recent cuts.
| Metric | Value |
|---|---|
| Sector | Technology |
| Dividend yield | 1.59% |
| Current dividend per share | 0.507 USD |
| Dividend history | 13 years |
| Last cut or suspension | None |
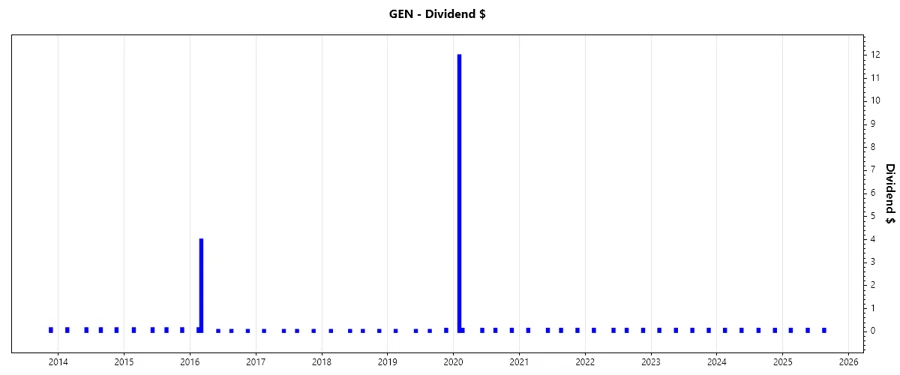
📈 Dividend History
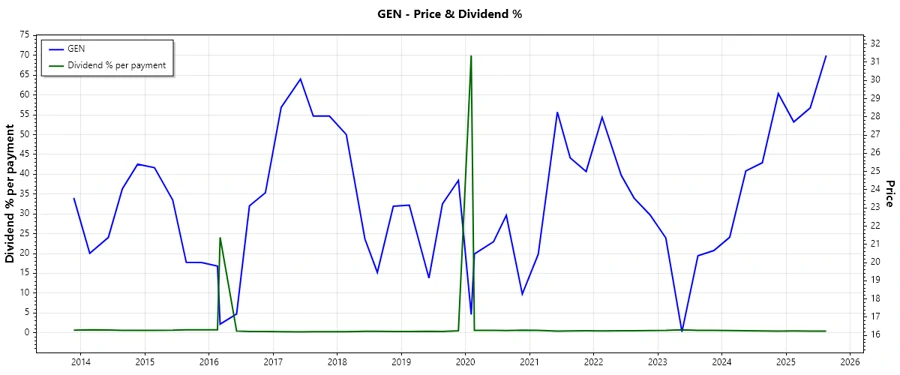
The dividend history of Gen Digital Inc. serves as a testament to the company’s robust financial health. For an investor, a consistent dividend flow is a critical indicator of stability and income reliability, especially in volatile markets.
| Year | Dividend per Share (USD) |
|---|---|
| 2025 | 0.375 |
| 2024 | 0.500 |
| 2023 | 0.500 |
| 2022 | 0.500 |
| 2021 | 0.500 |
📈 Dividend Growth
Dividend growth reflects a company's commitment to increasing shareholder returns. Gen Digital Inc.'s dividend growth has been slow, at 0% over three years and about 0.07% over five years. Although modest, such growth indicates that while the company might be focusing on reinvestment and strategic growth, it still aims to enhance shareholder value.
| Time | Growth |
|---|---|
| 3 years | 0% |
| 5 years | 7.39% |
The average dividend growth is 0.07% over 5 years. This shows moderate but steady dividend growth, aligning with the company’s focus on stability.
❔ Payout Ratio
Payout ratios indicate the proportion of earnings given back to shareholders as dividends, offering insight into the sustainability of such payments. Gen Digital Inc.'s EPS payout ratio stands at 52.43%, while the FCF payout ratio is a more conservative 23.16%.
| Key Figure | Ratio |
|---|---|
| EPS-based | 52.43% |
| Free cash flow-based | 23.16% |
These payout ratios suggest that Gen Digital Inc. has a healthy balance between returning value to shareholders and retaining earnings for growth and liquidity requirements.
💰 Cashflow & Capital Efficiency
An evaluation of cash flow and capital efficiency provides critical insights into the firm's operational health and its ability to manage capital effectively. With strong free cash flow yields and an efficient use of cash in both operating and capital expenditures, Gen Digital Inc. demonstrates effective management of operational resources and capital investments.
| Year | Free Cash Flow Yield | Earnings Yield | CAPEX to Operating Cash Flow | Stock-based Compensation to Revenue | Free Cash Flow / Operating Cash Flow Ratio |
|---|---|---|---|---|---|
| 2025 | 7.36% | 3.93% | 1.23% | 3.41% | 98.77% |
| 2024 | 14.38% | 4.27% | 0.97% | 3.63% | 99.03% |
| 2023 | 7.13% | 12.80% | 0.79% | 4.04% | 99.21% |
The strong cash flow yields and efficient capital usage underscore Gen Digital’s capacity to fuel growth without relying heavily on debt financing.
🧾 Balance Sheet & Leverage Analysis
The leverage analysis assists in understanding the company's financial risk profile. This involves examining debt ratios, liquidity ratios, and understanding how the company finances its operations.
| Year | Debt-to-Equity | Debt-to-Assets | Debt-to-Capital | Net Debt to EBITDA | Current Ratio | Quick Ratio |
|---|---|---|---|---|---|---|
| 2025 | 3.66 | 53.66% | 78.56% | 3.61 | 0.51 | 0.51 |
| 2024 | 4.04 | 54.80% | 80.18% | 4.88 | 0.50 | 0.50 |
| 2023 | 4.46 | 61.57% | 81.70% | 5.82 | 0.43 | 0.43 |
The leverage ratios, notably high Debt-to-Equity, suggest elevated financial risk, although the company maintains a cautious approach to liquidity.
📊 Fundamental Strength & Profitability
Evaluating profitability metrics such as ROE and ROA helps investors assess the effectiveness of a company in generating profits relative to its equity and assets. Understanding margins further clarifies cost management's impact on profitability.
| Year | Return on Equity | Return on Assets | Net Margin | EBIT Margin | EBITDA Margin | Gross Margin |
|---|---|---|---|---|---|---|
| 2025 | 28.34% | 4.15% | 16.34% | 40.84% | 51.49% | 80.28% |
| 2024 | 28.36% | 3.84% | 15.97% | 29.37% | 42.13% | 80.76% |
| 2023 | 61.32% | 8.46% | 40.67% | 36.33% | 46.94% | 82.24% |
With a robust ROE and solid profit margins across the board, Gen Digital Inc. demonstrates strong fundamental and profitability positions, beneficial for shareholder value enhancement.
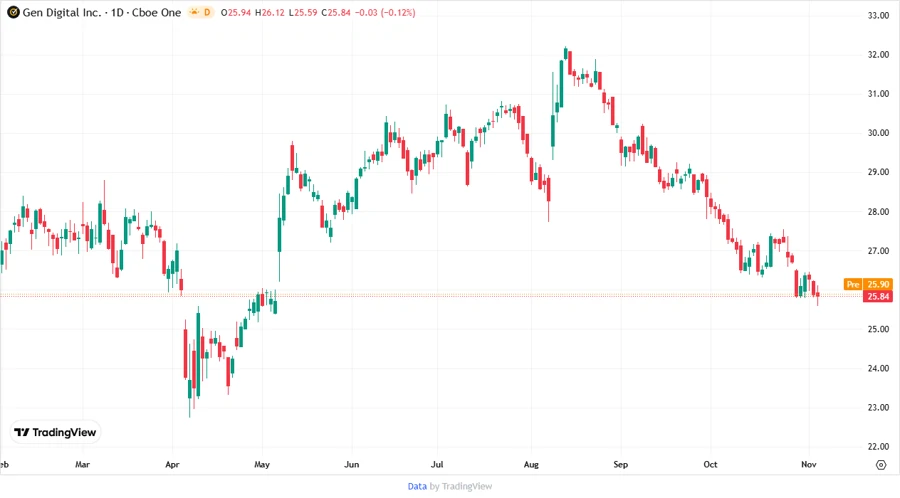
🔍 Price Development
🗝️ Dividend Scoring System
| Category | Score | Score Bar |
|---|---|---|
| Dividend Yield | 3 | |
| Dividend Stability | 4 | |
| Dividend Growth | 2 | |
| Payout Ratio | 3 | |
| Financial Stability | 3 | |
| Dividend Continuity | 5 | |
| Cashflow Coverage | 4 | |
| Balance Sheet Quality | 2 |
Total Score: 26/40
✅ Rating
In summary, Gen Digital Inc. presents a stable investment opportunity for dividend-seeking investors, with consistent payouts and a history of reliability. While some areas, such as dividend growth and balance sheet quality, present certain concerns, the overall financial health and profitability indicate a capable and financially disciplined company. Recommended for cautious income investors seeking dependable returns and moderate financial risk.
Smart Data Insight
Master the Perfect Entry & Exit for this Stock
Don't leave your profits to chance. Historically, this stock follows specific seasonal patterns that institutional traders use to maximize returns.
- ✅ Identify the "Golden Buying Window"
- ✅ Avoid high-risk correction cycles
- ✅ Backtested data from the last 20+ years