September 28, 2025 a 11:31 am

GEN: Dividend Analysis - Gen Digital Inc.
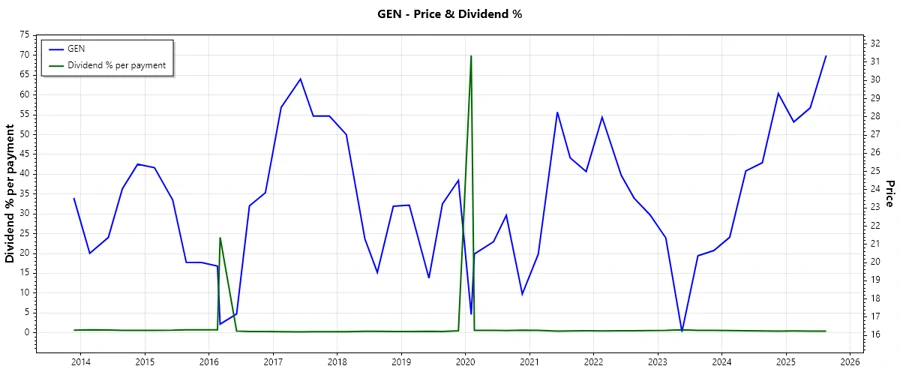
Gen Digital Inc. presents a robust dividend profile with a notable history of consistent payments. Despite facing market fluctuations, the company has maintained a stable dividend yield, reflecting its commitment to shareholders. The company's balance sheet showcases a healthy dividend history, underscoring the long-term reliability of Gen Digital as a dividend-paying entity. This report will dive into various aspects of Gen Digital's dividend profile to provide a comprehensive analysis for potential and current investors.
📊 Overview
Gen Digital Inc. performs within the Technology sector, a field characterized by rapid innovation and competition. Its current dividend yield stands at 1.59%. With a dividend per share of $0.51 USD and a history of 13 years of dividend payments, it reflects stability. Importantly, there have been no recent dividend cuts or suspensions, signaling strong financial health.
| Parameter | Value |
|---|---|
| Sector | Technology |
| Dividend Yield | 1.59% |
| Current Dividend per Share | $0.51 USD |
| Dividend History | 13 years |
| Last Cut or Suspension | None |
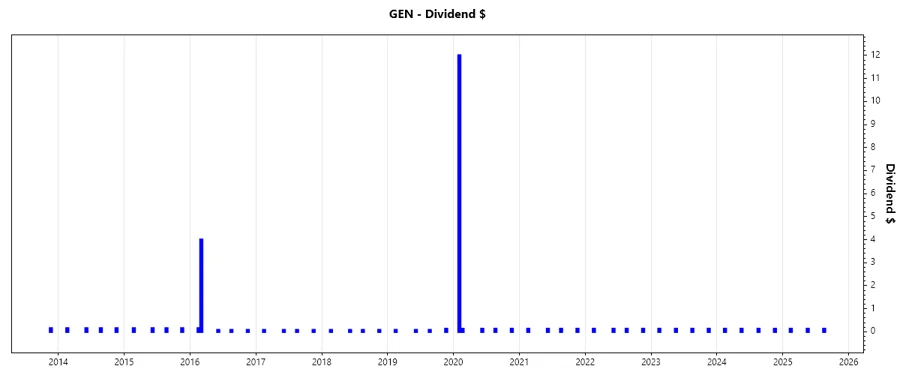
📜 Dividend History
The dividend history of Gen Digital highlights its commitment to maintaining shareholder returns. Understanding past dividend distributions helps predict future trends and potential stability in earnings and payouts.
| Year | Dividend per Share (USD) |
|---|---|
| 2025 | 0.375 |
| 2024 | 0.500 |
| 2023 | 0.500 |
| 2022 | 0.500 |
| 2021 | 0.500 |
📈 Dividend Growth
Dividend growth is a critical factor in assessing a company’s ability to increase shareholder returns over time. Analyzing the growth percentage over different periods gives insight into the consistency and growth trajectory of dividend payments.
| Time | Growth |
|---|---|
| 3 years | 0% |
| 5 years | 7.39% |
The average dividend growth is 7.39% over 5 years. This shows moderate but steady dividend growth.
📉 Payout Ratio
Payout ratio analysis offers insights into the sustainability of dividend payments. High payout ratios can indicate risk if earnings decrease.
| Key Figure | Ratio |
|---|---|
| EPS-based | 52.43% |
| Free cash flow-based | 23.16% |
The EPS payout ratio of 52.43% is moderate, indicating a balanced approach to returning profits to shareholders and retaining earnings for growth. The free cash flow-based payout ratio of 23.16% is sustainable, reflecting efficient cash flow management.
💲 Cashflow & Capital Efficiency
Assessing cash flow and capital efficiency ratios is essential for understanding operational proficiency and financial resilience. These metrics indicate how well a company converts income into cash flow and the return on investments.
| Metric | 2025 | 2024 | 2023 |
|---|---|---|---|
| Free Cash Flow Yield | 7.40% | 14.32% | 7.13% |
| Earnings Yield | 3.94% | 4.25% | 12.80% |
| CAPEX to Operating Cash Flow | 1.23% | 0.97% | 0.79% |
| Stock-based Compensation to Revenue | 3.41% | 3.63% | 4.04% |
| Free Cash Flow / Operating Cash Flow Ratio | 98.77% | 99.03% | 99.21% |
Gen Digital's cash flow ratios demonstrate high efficiency in capital usage with robust free cash flow yield, indicating strong cash generation capacity compared to earnings and superior capital returns.
📊 Balance Sheet & Leverage Analysis
Evaluating balance sheet metrics is fundamental for understanding financial stability, liquidity, and leverage. Proper leverage management ensures Gen Digital can uphold its financial obligations.
| Metric | 2025 | 2024 | 2023 |
|---|---|---|---|
| Debt-to-Equity | 3.66 | 4.04 | 4.46 |
| Debt-to-Assets | 53.67% | 54.80% | 61.57% |
| Debt-to-Capital | 78.56% | 80.18% | 81.70% |
| Net Debt to EBITDA | 3.89 | 4.88 | 5.82 |
| Current Ratio | 0.50 | 0.50 | 0.43 |
| Quick Ratio | 0.51 | 0.50 | 0.43 |
| Financial Leverage | 6.83 | 7.38 | 7.25 |
The relatively high leverage ratios suggest significant reliance on debt financing. While this can amplify returns, it also poses risks should revenue or cash flow decline.
💡 Fundamental Strength & Profitability
Solid fundamentals and profitability measures reflect a company's operational effectiveness and market positioning. It's crucial to measure both margins and return metrics for comprehensive analysis.
| Metric | 2025 | 2024 | 2023 |
|---|---|---|---|
| Return on Equity | 28.34% | 28.36% | 61.32% |
| Return on Assets | 4.15% | 3.84% | 8.46% |
| Margins: Net | 16.34% | 15.97% | 40.67% |
| Margins: EBIT | 40.84% | 29.37% | 36.33% |
| Margins: EBITDA | 51.49% | 42.13% | 46.94% |
| Margins: Gross | 80.28% | 80.76% | 82.24% |
| Research & Development to Revenue | 8.45% | 8.74% | 9.44% |
Gen Digital Inc.'s profitability metrics are robust, especially its gross and EBITDA margins, indicating strong cost management. High R&D spending accentuates innovation and future growth potential.
📈 Price Development
✅ Dividend Scoring System
| Criteria | Score (1-5) | Score Bar |
|---|---|---|
| Dividend Yield | 3 | |
| Dividend Stability | 4 | |
| Dividend Growth | 3 | |
| Payout Ratio | 3 | |
| Financial Stability | 3 | |
| Dividend Continuity | 5 | |
| Cashflow Coverage | 4 | |
| Balance Sheet Quality | 3 |
Total Score: 28/40
🔍 Rating
Gen Digital Inc. maintains a solid dividend profile suitable for risk-tolerant investors seeking moderate income with potential for growth. While its current dividend yield is average, consistent payouts and prudent financial management bolster its investment appeal. However, its high leverage requires careful monitoring. Overall, Gen Digital is a sound choice for those prioritizing stable dividends with growth prospects.
Smart Data Insight
Master the Perfect Entry & Exit for this Stock
Don't leave your profits to chance. Historically, this stock follows specific seasonal patterns that institutional traders use to maximize returns.
- ✅ Identify the "Golden Buying Window"
- ✅ Avoid high-risk correction cycles
- ✅ Backtested data from the last 20+ years