August 07, 2025 a 11:31 am

GEN: Dividend Analysis - Gen Digital Inc.
With a substantial history of consistent dividend payouts over 13 years, Gen Digital Inc. showcases resilience in dividend strategy. Despite no significant growth in dividends over the last 3 years, the company's disciplined payout strategy, with a payout ratio of 48.6% based on EPS and only 25.9% based on free cash flow, suggests a conservative approach favoring sustainability over aggressive growth. The company's position in the technology sector often implies volatile earnings; however, this strategy provides a measure of stability for dividend-seeking investors.
📊 Overview
Gen Digital Inc., part of the technology sector, has maintained a dividend yield of 1.76%. The current dividend per share stands at 0.51 USD, reflecting 13 years of dividend history. Notably, the company has not cut or suspended dividends in recent history, highlighting reliability in its payout commitments.
| Metric | Data |
|---|---|
| Sector | Technology |
| Dividend Yield | 1.76 % |
| Current Dividend Per Share | 0.51 USD |
| Dividend History | 13 years |
| Last Cut or Suspension | None |
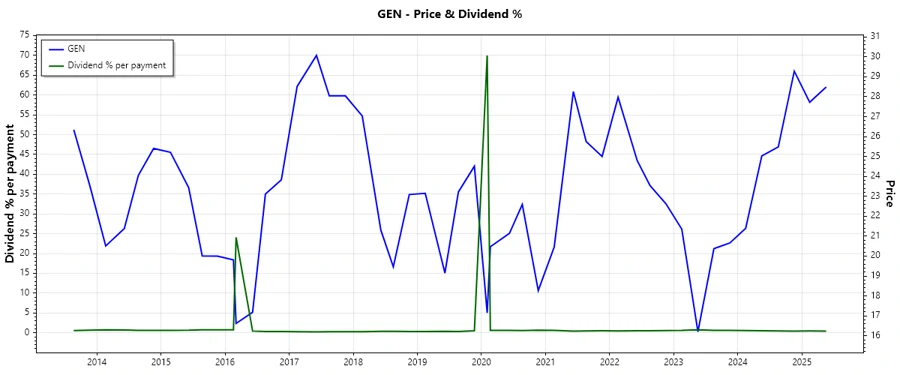
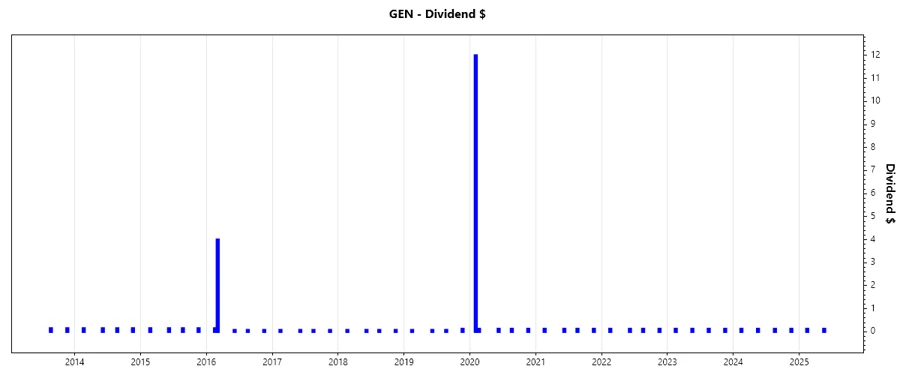
📈 Dividend History
The continuity in dividend payments holds substantial value for income-focused investors. Regularity in dividends rebuilds confidence and signifies corporate stability. Recently, Gen Digital Inc. has maintained a steady payment structure.
| Year | Dividend Per Share (USD) |
|---|---|
| 2025 | 0.25 |
| 2024 | 0.50 |
| 2023 | 0.50 |
| 2022 | 0.50 |
| 2021 | 0.50 |
📈 Dividend Growth
Dividend growth is a critical factor that reflects a company's rising profitability and commitment to returning capital to shareholders. Notably, the growth rate in dividends over the past 3 years has been stagnant; however, there is minor increase observed across a 5-year horizon.
| Time | Growth |
|---|---|
| 3 years | 0 % |
| 5 years | 7.39 % |
The average dividend growth is 7.39% over 5 years. This indicates moderate but steady dividend growth.
🗣️ Payout Ratio
The payout ratio is a key measure of a company's dividend affordability. High payout ratios signal potential vulnerability during downturns, while lower ratios indicate room for dividend increases.
| Key figure | Ratio |
|---|---|
| EPS-based | 48.60 % |
| Free cash flow-based | 25.90 % |
Given a 48.60% EPS-based ratio and a 25.90% FCF-based ratio, Gen Digital Inc. maintains a balanced payout framework, allowing flexibility for future dividend enhancements or investments.
🗣️ Cashflow & Capital Efficiency
Cashflow and capital efficiency are critical in evaluating a company's operational health and solvency. Gen Digital Inc.'s metrics reflect efficient utilization of its capital generation capabilities.
| Metric | 2023 | 2024 | 2025 |
|---|---|---|---|
| Free Cash Flow Yield | 7.13 % | 14.32 % | 7.40 % |
| Earnings Yield | 12.80 % | 4.25 % | 3.94 % |
| CAPEX to Operating Cash Flow | 0.79 % | 0.97 % | 1.23 % |
| Stock-based Compensation to Revenue | 4.01 % | 3.63 % | 3.38 % |
| Free Cash Flow / Operating Cash Flow Ratio | 99.21 % | 99.03 % | 98.77 % |
The company's strong free cash flow yield and high free cash flow to operating cash flow ratios demonstrate sound liquidity management and prudent reinvestment strategies.
📉 Balance Sheet & Leverage Analysis
Analyzing balance sheet health is crucial for understanding leverage, liquidity, and financial robustness. Gen Digital Inc.'s metrics offer insights into its debt management efficiency and overall economic strength.
| Metric | 2023 | 2024 | 2025 |
|---|---|---|---|
| Debt-to-Equity | 4.46 | 3.94 | 3.66 |
| Debt-to-Assets | 61.57 % | 54.88 % | 53.66 % |
| Debt-to-Capital | 81.70 % | 79.75 % | 78.56 % |
| Net Debt to EBITDA | 5.82 | 4.88 | 3.61 |
| Current Ratio | 0.43 | 0.51 | 0.51 |
| Quick Ratio | 0.42 | 0.51 | 0.51 |
Despite a declining debt-to-equity ratio, the company's elevated debt levels could pose risks in tighter credit environments, suggesting a need for disciplined balance sheet management.
📉 Fundamental Strength & Profitability
Evaluating profitability metrics offers a window into a company's efficiency and long-term viability. Gen Digital Inc.'s strength is reflected in margins and returns on investment.
| Metric | 2023 | 2024 | 2025 |
|---|---|---|---|
| Return on Equity | 61.32 % | 27.63 % | 28.34 % |
| Return on Assets | 8.46 % | 3.85 % | 4.15 % |
| Net Margin | 40.41 % | 15.97 % | 16.34 % |
| EBIT Margin | 36.10 % | 29.37 % | 40.84 % |
| EBITDA Margin | 46.64 % | 42.13 % | 51.49 % |
| Gross Margin | 82.35 % | 80.76 % | 80.28 % |
The robust returns on equity and margins signify operational excellence and a competitive advantage in capital deployment strategies.
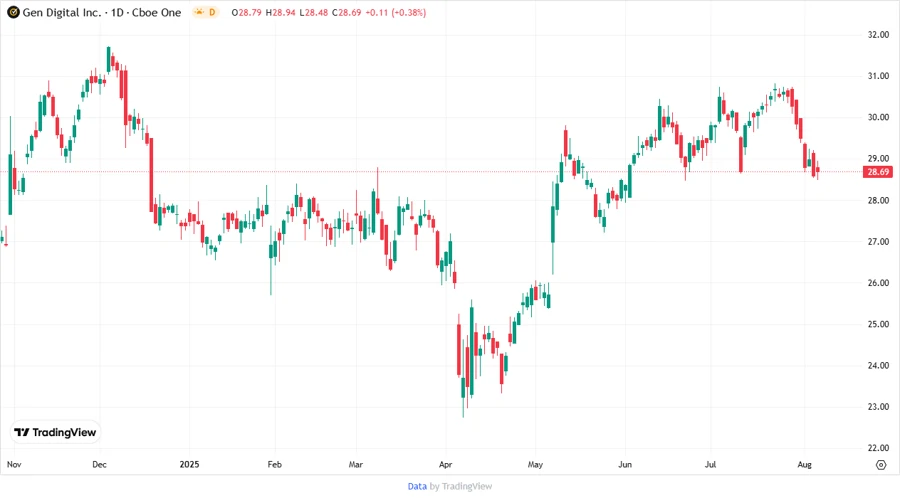
📊 Price Development
✅ Dividend Scoring System
| Category | Score (out of 5) | Score Bar |
|---|---|---|
| Dividend Yield | 3 | |
| Dividend Stability | 4 | |
| Dividend Growth | 3 | |
| Payout Ratio | 4 | |
| Financial Stability | 3 | |
| Dividend Continuity | 5 | |
| Cashflow Coverage | 4 | |
| Balance Sheet Quality | 3 |
Total Score: 29/40
✅ Rating
Overall, Gen Digital Inc. maintains a prudent dividend policy backed by solid cash flow and moderate financial leverage. Despite some growth limitations in recent years, the company's operational health reflects robustness, making it a viable candidate for long-term income investors. Recommended as a potentially stable dividend investment, though with a mindful look at evolving market conditions.
Smart Data Insight
Master the Perfect Entry & Exit for this Stock
Don't leave your profits to chance. Historically, this stock follows specific seasonal patterns that institutional traders use to maximize returns.
- ✅ Identify the "Golden Buying Window"
- ✅ Avoid high-risk correction cycles
- ✅ Backtested data from the last 20+ years