June 24, 2025 a 03:31 am

GEN: Dividend Analysis - Gen Digital Inc.
Gen Digital Inc. offers a consistent dividend yield with a relatively stable payout history. Despite its modest growth in past years, the company shows potential for sustained investor returns, given its strategic financial management and sectoral position.
📊 Overview
Gen Digital Inc. operates in a competitive sector with disciplined dividend management, reflected in stable yields and uninterrupted payout history over 13 years.
| Metric | Value |
|---|---|
| Sector: | Technology |
| Dividend Yield: | 1.76% |
| Current Dividend per Share: | 0.51 USD |
| Dividend History: | 13 years |
| Last Cut or Suspension: | None |
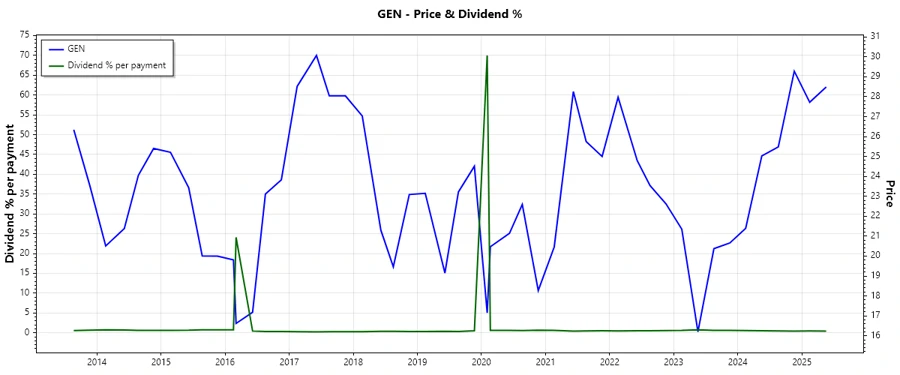
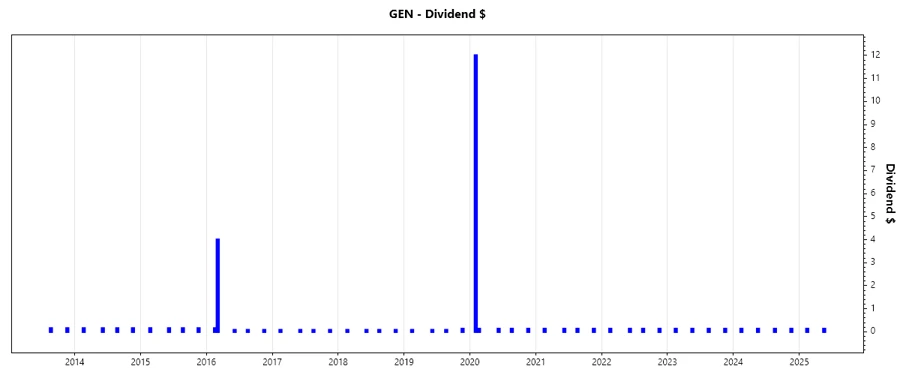
🗣️ Dividend History
The dividend history showcases Gen Digital Inc.'s commitment to shareholder returns with a consistent payout over the years, highlighting its resilience in varying market conditions.
| Year | Dividend per Share (USD) |
|---|---|
| 2025 | 0.25 |
| 2024 | 0.50 |
| 2023 | 0.50 |
| 2022 | 0.50 |
| 2021 | 0.50 |
📈 Dividend Growth
Over the past 3 to 5 years, Gen Digital Inc.'s dividend growth has been slow, however, it depicts a cautious yet progressive financial strategy aimed at ensuring long-term shareholder value.
| Time | Growth |
|---|---|
| 3 years | 0% |
| 5 years | 7.39% |
The average dividend growth is 7.39% over 5 years. This shows moderate but steady dividend growth.
📊 Payout Ratio
Evaluating Gen Digital Inc.'s payout ratios showcases a strategic value balance between redistributing earnings and maintaining a robust operational framework.
| Key Figure | Ratio |
|---|---|
| EPS-based | 48.60% |
| Free cash flow-based | 26.09% |
EPS-based payout ratio at 48.60% and FCF-based at 26.09% suggest a balanced reinvestment and dividend strategy safeguarding financial flexibility.
Cashflow & Capital Efficiency
Gen Digital Inc.'s cash flow management is indicative of potent capital allocation with substantial yields from operations, emphasizing efficient capital reinvestment.
| Metric | 2025 | 2024 | 2023 |
|---|---|---|---|
| Free Cash Flow Yield | 7.40% | 14.32% | 7.13% |
| Earnings Yield | 3.94% | 4.32% | 12.80% |
| CAPEX to Operating Cash Flow | 1.23% | 0.97% | 0.79% |
| Stock-based Compensation to Revenue | 3.38% | 3.62% | 4.01% |
| Free Cash Flow / Operating Cash Flow Ratio | 98.77% | 99.03% | 99.21% |
With strong free cash flow management and robust capital efficiency, Gen Digital ensures reliable cash flow coverage and reinforcement of the company's long-term viability.
➡️ Balance Sheet & Leverage Analysis
Solid leverage management and prudent debt strategies have allowed Gen Digital Inc. to uphold financial stability, despite industry fluctuations.
| Metric | 2025 | 2024 | 2023 |
|---|---|---|---|
| Debt-to-Equity | 3.66 | 3.94 | 4.46 |
| Debt-to-Assets | 53.66% | 54.88% | 61.57% |
| Debt-to-Capital | 78.56% | 79.75% | 81.70% |
| Net Debt to EBITDA | 4.54 | 4.84 | 5.82 |
| Current Ratio | 0.51 | 0.51 | 0.43 |
| Quick Ratio | 0.51 | 0.51 | 0.42 |
| Financial Leverage | 6.83 | 7.18 | 7.25 |
Despite a high financial leverage ratio, Gen Digital's debt management and liquidity ratios emphasize strong financial discipline, providing reassurance against systemic risks.
✅ Fundamental Strength & Profitability
Gen Digital Inc. displays formidable operational margins and return parameters, affirming its robust profitability and strategic market positioning.
| Metric | 2025 | 2024 | 2023 |
|---|---|---|---|
| Return on Equity | 28.34% | 28.04% | 61.31% |
| Return on Assets | 4.15% | 3.91% | 8.46% |
| Net Margin | 16.34% | 16.16% | 40.41% |
| EBIT Margin | N/A | 29.59% | 36.10% |
| EBITDA Margin | 40.91% | 42.31% | 46.64% |
| Gross Margin | 80.28% | 80.82% | 82.35% |
| R&D to Revenue | 8.36% | 8.71% | 9.38% |
Gen Digital's ROE and profitability metrics highlight substantial earning capabilities, underlining its comprehensive competitive advantages and innovative edge.
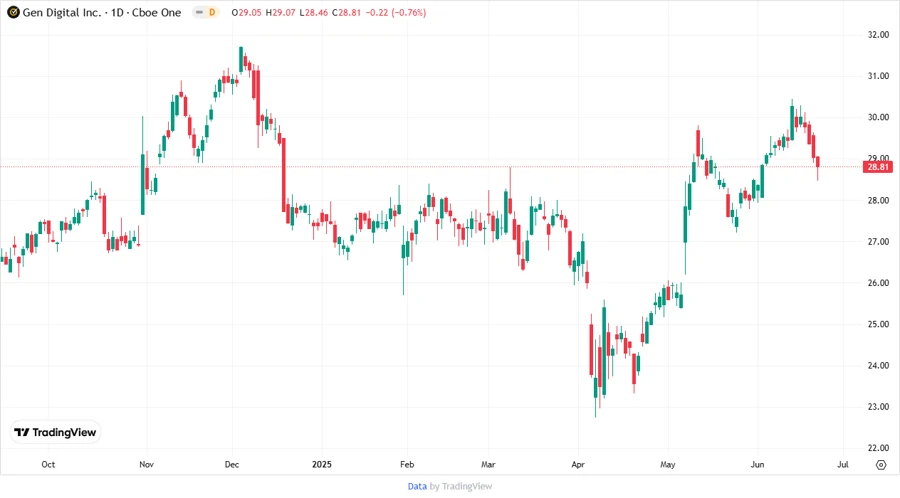
📉 Price Development
🗂️ Dividend Scoring System
| Criteria | Score (1-5) | Visualization |
|---|---|---|
| Dividend Yield | 3 | |
| Dividend Stability | 4 | |
| Dividend Growth | 2 | |
| Payout Ratio | 4 | |
| Financial Stability | 3 | |
| Dividend Continuity | 5 | |
| Cashflow Coverage | 4 | |
| Balance Sheet Quality | 3 |
Total Score: 28/40
🔍 Rating
Gen Digital Inc. stands as a moderately appealing segment within dividend investing, courtesy of its balance between stability and limited growth. Despite high leverage, its operational prowess and commitment to dividend continuity provide a dependable income source for investors prioritizing security over rapid expansion.
Smart Data Insight
Master the Perfect Entry & Exit for this Stock
Don't leave your profits to chance. Historically, this stock follows specific seasonal patterns that institutional traders use to maximize returns.
- ✅ Identify the "Golden Buying Window"
- ✅ Avoid high-risk correction cycles
- ✅ Backtested data from the last 20+ years