February 15, 2026 a 11:44 am
GEHC: Fibonacci Analysis - GE HealthCare Technologies Inc.
GE HealthCare Technologies Inc. has shown significant potential given its involvement in multiple health-related segments globally. The stock has experienced notable price fluctuations, creating opportunities for both investors and traders. Understanding the recent trends can provide valuable insights into future movements.
Fibonacci Analysis
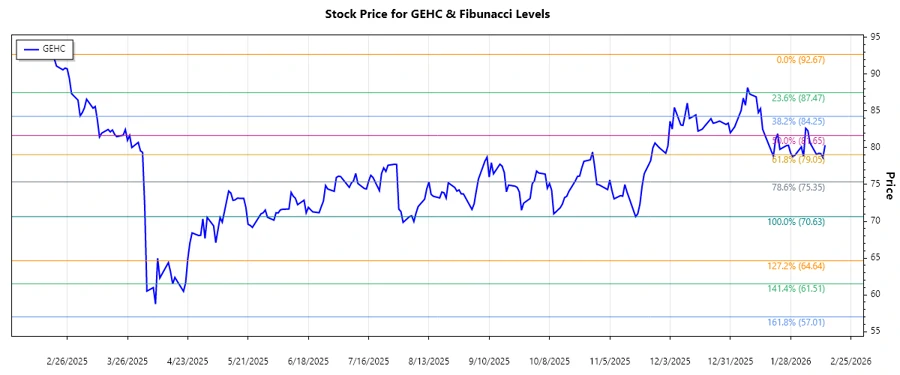
The following analysis is based on the recent downtrend observed in GE HealthCare Technologies Inc.'s price data.
| Start Date | End Date | High Price (Date) | Low Price (Date) |
|---|---|---|---|
| 2025-02-18 | 2026-01-08 | $92.67 (2025-02-18) | $70.63 (2025-11-17) |
| Fibonacci Level | Price Level |
|---|---|
| 0.236 | $76.52 |
| 0.382 | $79.12 |
| 0.5 | $81.65 |
| 0.618 | $84.18 |
| 0.786 | $87.29 |
The current price, as of the latest date, is within the 0.382 Fibonacci retracement level, indicating a potential area of support or resistance. This can imply that the price might stabilize or reverse at this level, making it crucial for potential long or short trades.
Conclusion
The observed downtrend in GEHC indicates a decline from its high earlier in 2025. The stock is currently navigating around the 38.2% Fibonacci retracement level, often considered a critical point to watch for price support or resistance. While this could suggest the potential stabilization of the stock, it simultaneously poses risks if the price dips further, indicating ongoing bearish sentiment. Continuous observation of the market conditions and additional technical indicators would be prudent for investors considering engagement with GE HealthCare Technologies Inc. stock.