February 08, 2026 a 05:15 am
GEHC: Fibonacci Analysis - GE HealthCare Technologies Inc.
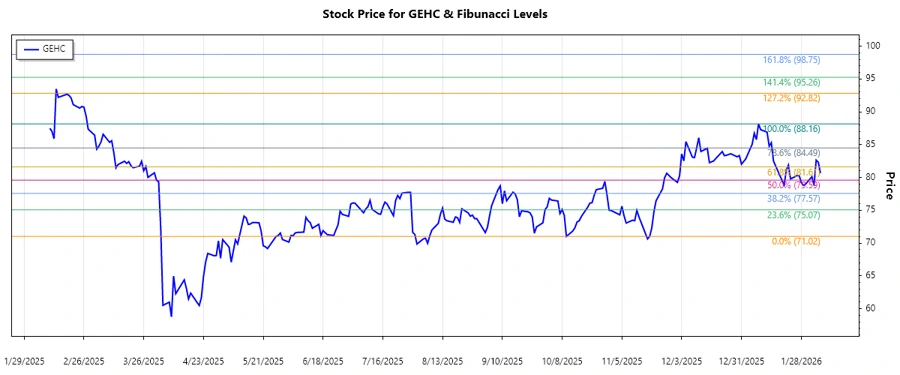
The analysis of GE HealthCare Technologies Inc. (GEHC) reveals a volatile trading period, with a significant upward trend identified. The company, being a key player in the medical technology industry, has seen varied performances across its segments including Imaging, Ultrasound, and Pharmaceutical Diagnostics. A comprehensive Fibonacci analysis is applied to the observed trend to project potential support and resistance levels.
Fibonacci Analysis
| Trend Attributes | Details |
|---|---|
| Start Date | 2025-11-18 |
| End Date | 2026-01-12 |
| High | $88.16 on 2026-01-08 |
| Low | $71.02 on 2025-11-18 |
| Fibonacci Level | Price Level |
|---|---|
| 0.236 | $75.69 |
| 0.382 | $79.59 |
| 0.5 | $84.59 |
| 0.618 | $85.72 |
| 0.786 | $87.21 |
The current price is situated around $82.63, which indicates it is within the 0.382 and 0.5 retracement levels. This zone may act as a support level, suggesting potential stabilization before any further movements.
Conclusion
In conclusion, GE HealthCare Technologies Inc. has experienced a notable upswing, positioning itself as a strong contender in the healthcare sector. The identified retracement levels provide critical insights into potential support, suggesting a temporary stabilization in the current trading range. However, investors should be wary of macroeconomic factors and the company’s ability to innovate within its segments, which could impact future performance. As such, a cautious strategy is advisable, balancing the observed technical indicators and the fundamental strengths of GEHC.