July 03, 2025 a 10:15 am

GEHC: Fibonacci Analysis - GE HealthCare Technologies Inc.
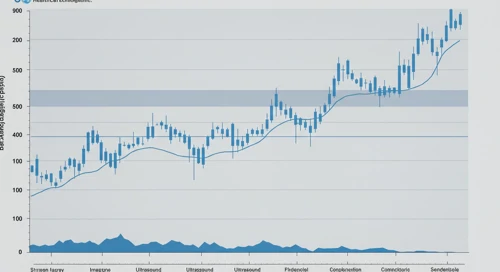
GE HealthCare Technologies Inc. has demonstrated a notable shift in its financial performance over the recent months amidst a competitive medical technologies industry. The stock has experienced both impressive growth periods and points of resistance suggesting technical levels worthy of analysis. Identifying the recent dominant trend is crucial for investors seeking to capitalize on the company's market position despite sector volatilities.
Fibonacci Analysis
| Attribute | Details |
|---|---|
| Trend Start Date | 2025-03-11 |
| Trend End Date | 2025-07-02 |
| Highest Price | 85.59 (2025-03-11) |
| Lowest Price | 60.48 (2025-04-21) |
| Fibonacci Level 0.236 | 66.47 |
| Fibonacci Level 0.382 | 69.88 |
| Fibonacci Level 0.5 | 73.04 |
| Fibonacci Level 0.618 | 76.20 |
| Fibonacci Level 0.786 | 80.13 |
| Current Price Status | The current price of $76.12 is in the 0.618 retracement zone. |
| Technical Interpretation | This current level suggests a potential area of support where investors could anticipate price stabilization or a reversal opportunity. |
Conclusion
The recent upward trend in GE HealthCare Technologies Inc.'s stock suggests significant bullish momentum despite broader market uncertainties. While the stock currently sits within a key Fibonacci level, potential support may foster renewed investor optimism, offering both opportunities and cautions against volatility fluctuations. This positive trajectory and strategic positioning within retracement levels provide analysts grounds for predicting resilience and potential price advancements, contingent upon market dynamics and corporate performance.
Smart Data Insight
Master the Perfect Entry & Exit for this Stock
Don't leave your profits to chance. Historically, this stock follows specific seasonal patterns that institutional traders use to maximize returns.
- ✅ Identify the "Golden Buying Window"
- ✅ Avoid high-risk correction cycles
- ✅ Backtested data from the last 20+ years