June 18, 2025 a 04:44 pm

GEHC: Fibonacci Analysis - GE HealthCare Technologies Inc.
GE HealthCare Technologies Inc. has shown varying performance metrics due to its diversified business segments across global markets. With its substantial focus on imaging and digital solutions, the stock has experienced significant movements in line with market demand for medical technologies. Recent price changes reflect these dynamics, emphasizing the importance of technical analysis for stakeholders.
Fibonacci Analysis
| Details | Information |
|---|---|
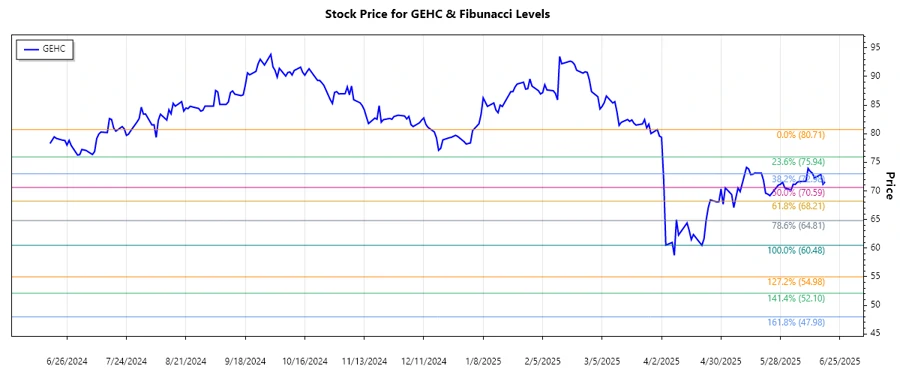
| Trend Period | 2025-03-31 to 2025-06-18 |
| High Point | $80.71 on 2025-03-31 |
| Low Point | $60.48 on 2025-06-18 |
| Retracement Level | Price Level |
|---|---|
| 23.6% | $64.94 |
| 38.2% | $67.63 |
| 50.0% | $70.60 |
| 61.8% | $73.57 |
| 78.6% | $77.33 |
The current price is around $71.58, placing it within the 50.0% retracement zone. This suggests a critical evaluation point where the price could either bounce back or break further down.
The 50.0% retracement level often acts as a strong support or resistance, indicating potential price containment before a trend continuation or reversal.
Conclusion
GE HealthCare Technologies Inc. is navigating a complex market environment characterized by fluctuating prices affected by external market conditions and internal strategic moves. With its current position at a critical Fibonacci retracement, it offers both opportunities and risks for investors. Technically, significant levels could determine near-term price changes, while long-term trends may depend on broader market performance and company actions. Analyst outlook should consider macroeconomic influences, industry trends, and technological investments within GEHC's operational scope for accurate forecasts.
Smart Data Insight
Master the Perfect Entry & Exit for this Stock
Don't leave your profits to chance. Historically, this stock follows specific seasonal patterns that institutional traders use to maximize returns.
- ✅ Identify the "Golden Buying Window"
- ✅ Avoid high-risk correction cycles
- ✅ Backtested data from the last 20+ years