February 16, 2026 a 01:15 pm


GD: Trend and Support & Resistance Analysis - General Dynamics Corporation
General Dynamics Corporation, a key player in the aerospace and defense industry, exhibits robust technical patterns in recent months. This analysis reveals the short to medium-term trends, support, and resistance zones critical for potential investors and market analysts. As of the latest data, there is a visible technical indication of momentum. Careful consideration of these metrics could inform investment decisions for those tracking industrial advancements.
Trend Analysis
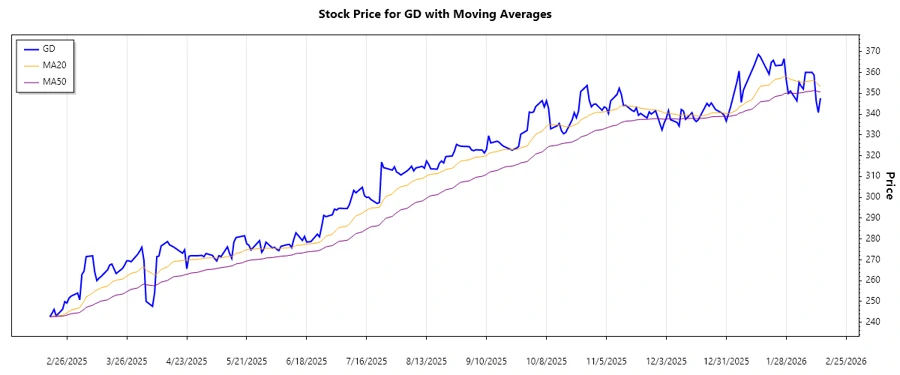
The technical analysis based on exponential moving averages (EMA) suggests a short- to medium-term trend pattern in General Dynamics Corporation's stock. The EMA20 and EMA50 calculations indicate a trend that guides our market analysis.
| Date | Closing Price | Trend |
|---|---|---|
| 2026-02-13 | 347.64 | ▲ Upward |
| 2026-02-12 | 340.75 | ▲ Upward |
| 2026-02-11 | 346.34 | ▲ Upward |
| 2026-02-10 | 358.83 | ▲ Upward |
| 2026-02-09 | 360.10 | ▲ Upward |
| 2026-02-06 | 360.07 | ▲ Upward |
| 2026-02-05 | 352.05 | ▲ Upward |
The presence of a consistent upward trend in EMA20 over EMA50 suggests positive momentum in stock pricing, indicative of a burgeoning uptrend in GD's market performance.
Support and Resistance
The technical structure suggests identifiable zones of support and resistance, crucial for understanding the market's directional bias and price ceiling potential.
| Zone Type | From | To |
|---|---|---|
| Support | $340.75 | $346.34 |
| Support | $320.00 | $330.00 |
| Resistance | $360.00 | $364.00 |
| Resistance | $370.00 | $375.00 |
The current price slightly falls within the identified resistance zone, suggesting potential testing for breakout or retracement critical for traders and analysts.
Conclusion
With a demonstrated upward trend based on EMA analysis, GD's stock exhibits promising growth potential. The support zones provide a safety net for pricing, whereas resistance levels offer a challenge, presenting both opportunity and risk. This pattern is significant for traders looking to capitalize on breakout scenarios or support-bounce opportunities. Ongoing monitoring of these patterns will provide insight into GD's future price movements and investment potential.