August 18, 2025 a 03:15 am

GD: Trend and Support & Resistance Analysis - General Dynamics Corporation
General Dynamics Corporation, a prominent player in aerospace and defense, shows positive momentum in its stock performance. The recent data indicates an upward trend, bolstered by favorable market conditions and company performance. Investors should monitor key support and resistance levels for potential entry and exit signals.
Trend Analysis
| Date | Closing Price | Trend |
|---|---|---|
| 2025-08-15 | $313.69 | ▲ Uptrend |
| 2025-08-14 | $315.84 | ▲ Uptrend |
| 2025-08-13 | $317.49 | ▲ Uptrend |
| 2025-08-12 | $314.01 | ▲ Uptrend |
| 2025-08-11 | $314.93 | ▲ Uptrend |
| 2025-08-08 | $314.13 | ▲ Uptrend |
| 2025-08-07 | $312.73 | ▲ Uptrend |
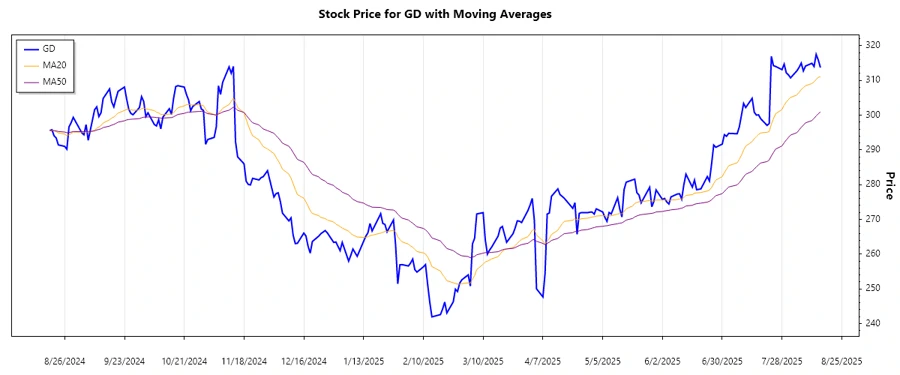
The calculated EMAs suggest a strong upward trend, supported by stable closes and consistent increases. This indicates bullish sentiment.
Support and Resistance
| Zone Type | Zone From | Zone To |
|---|---|---|
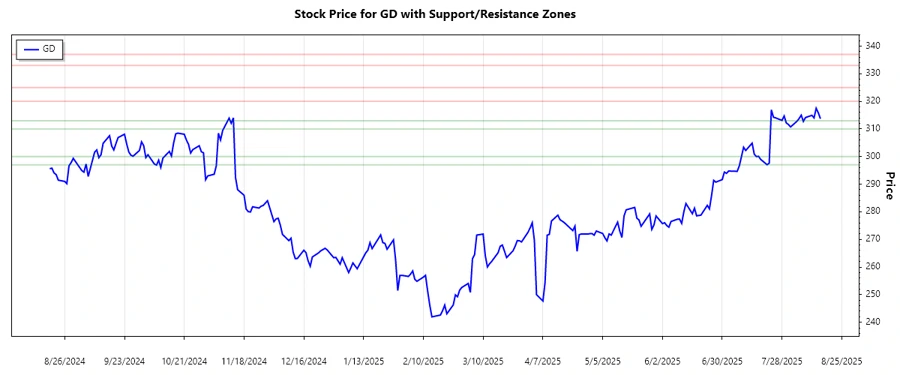
| Support ▼ | $297.00 | $300.00 |
| Support ▼ | $310.00 | $313.00 |
| Resistance ▲ | $320.00 | $325.00 |
| Resistance ▲ | $333.00 | $337.00 |
The current price is approaching the lower resistance zone, suggesting that investors should watch for a breakout or reversal.
Conclusion
The General Dynamics Corporation stock exhibits a strong uptrend with robust support zones, offering a solid foundation for bullish strategies. The technical indicators and market dynamics signal potential growth, although investors must remain vigilant of resistance zones that might trigger pullbacks. The stock's outlook is favorable but not without risks; market fluctuations or unforeseen company-specific issues could influence performance.
Smart Data Insight
Master the Perfect Entry & Exit for this Stock
Don't leave your profits to chance. Historically, this stock follows specific seasonal patterns that institutional traders use to maximize returns.
- ✅ Identify the "Golden Buying Window"
- ✅ Avoid high-risk correction cycles
- ✅ Backtested data from the last 20+ years