May 31, 2026 a 07:43 pm

GD: Fundamental Ratio Analysis - General Dynamics Corporation
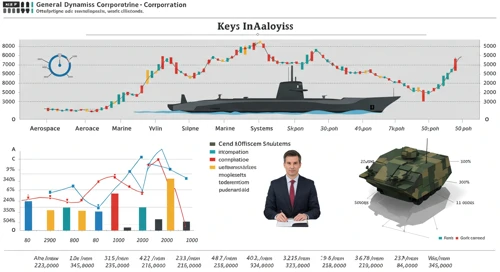
General Dynamics Corporation, a global leader in aerospace and defense, has established a solid market presence. With diverse operations spanning across various segments, the company's stock presents a balanced risk-to-reward ratio. Robust fundamentals and consistent historical performance make it a steady option for long-term investors.
Fundamental Rating
General Dynamics showcases strong fundamentals with ratings bolstering investor confidence.
| Category | Score | Visualization |
|---|---|---|
| Discounted Cash Flow | 4 | |
| Return On Equity | 5 | |
| Return On Assets | 5 | |
| Debt to Equity | 3 | |
| Price to Earnings | 2 | |
| Price to Book | 2 |
Historical Rating
The historical data reinforces the company's stable and consistent performance.
| Date | Overall | DCF | ROE | ROA | D/E | P/E | P/B |
|---|---|---|---|---|---|---|---|
| 2026-05-28 | 4 | 4 | 5 | 5 | 3 | 2 | 2 |
| Previous Date | 0 | 4 | 5 | 5 | 3 | 2 | 2 |
Analyst Price Targets
Analyst projections indicate a positive outlook with a consensus rating aligning with a 'Buy'.
| High | Low | Median | Consensus |
|---|---|---|---|
| $444 | $371 | $409 | $408.83 |
Analyst Sentiment
The sentiment among analysts shows a majority favoring a 'Buy'.
| Recommendation | Number | Distribution |
|---|---|---|
| Strong Buy | 0 | |
| Buy | 17 | |
| Hold | 16 | |
| Sell | 1 | |
| Strong Sell | 0 |
Conclusion
General Dynamics offers steady growth backed by a strong market position in the aerospace and defense sector. While current valuations suggest the stock is fairly priced, the robust fundamentals and positive analyst sentiment provide optimism for future appreciation. Nevertheless, geopolitical influences and industry-specific risks should be considered. Overall, it remains a compelling investment option for those seeking exposure in this industry.
Smart Data Insight
Master the Perfect Entry & Exit for this Stock
Don't leave your profits to chance. Historically, this stock follows specific seasonal patterns that institutional traders use to maximize returns.
- ✅ Identify the "Golden Buying Window"
- ✅ Avoid high-risk correction cycles
- ✅ Backtested data from the last 20+ years