April 21, 2026 a 11:44 am
GD: Fibonacci Analysis - General Dynamics Corporation
General Dynamics Corporation, with its wide-ranging portfolio in aerospace and defense, has shown resilient performance in the stock market. The company operates in key segments which position it advantageously against economic fluctuations. A timely analysis of the stock reveals the current technical landscape and potential price movements. Recent data indicates a dominant trend, crucial for estimating future price action through the application of Fibonacci tools.
Fibonacci Analysis
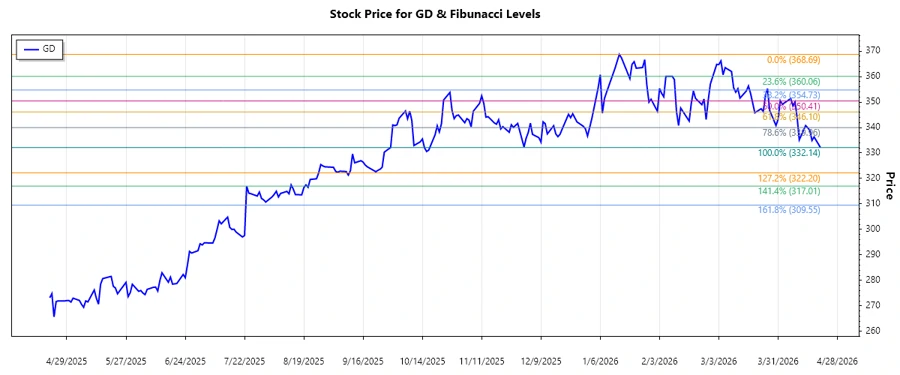
The analysis identifies a dominant downtrend for GD's stock from early January to mid-April 2026. This observation is based on historical price data, indicating a peak at $368.69 on 2026-01-15 and a trough at $332.14 on 2026-04-20. Utilizing these points, we have computed the Fibonacci retracement levels:
| Detail | Value |
|---|---|
| Trend Period | 2026-01-15 to 2026-04-20 |
| High Point | $368.69 on 2026-01-15 |
| Low Point | $332.14 on 2026-04-20 |
Fibonacci Retracement Levels
| Level | Price |
|---|---|
| 0.236 | $359.64 |
| 0.382 | $354.91 |
| 0.5 | $350.41 |
| 0.618 | $345.91 |
| 0.786 | $339.85 |
Current price levels are near $332.14 suggesting the stock is close to breaching the 0.786 retracement at $339.85. This zone may act as a critical support level. If breached, further bearish momentum might ensue.
Conclusion
The Fibonacci retracement analysis provides strategic insights into General Dynamics' stock. While the stock remains near its lower boundaries, attention should be given to potential triggers that might catalyze reversals. Analysts should consider both global market conditions and sector-specific developments, especially in aerospace and defense, which could influence stock recovery or further decline. With important support levels nearing, a breakthrough or rebound could decisively shape short-to-medium-term price targets.