September 07, 2025 a 10:15 am
GD: Fibonacci Analysis - General Dynamics Corporation
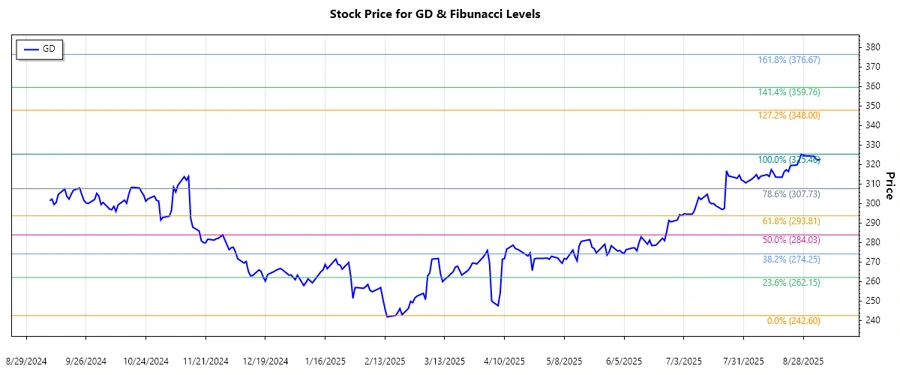
General Dynamics Corporation has shown a significant upward momentum over the past few months. The company's stock, driven by its strong market position in the aerospace and defense sectors, has been consistently reaching new heights. Technical analysis of the recent trend indicates an ongoing bullish sentiment, which could attract further interest from both institutional and retail investors.
Fibonacci Analysis
| Start Date | End Date | High Price | Low Price |
|---|---|---|---|
| 2025-02-20 | 2025-09-05 | $325.46 (2025-08-27) | $242.60 (2025-02-18) |
| Fibonacci Level | Price Level |
|---|---|
| 0.236 | $259.11 |
| 0.382 | $277.27 |
| 0.5 | $292.03 |
| 0.618 | $306.79 |
| 0.786 | $324.23 |
The current price is situated within the 0.618 retracement zone. This area can potentially act as a support level in the event of a downward correction. Should the price hold above this level, it would suggest continued strength and the possibility for further gains, potentially testing resistance levels at the 0.786 zone.
Conclusion
General Dynamics Corporation has been experiencing a robust upward trajectory, driven by positive market sentiment and strong performance in its core sectors. The identified Fibonacci retracement levels reveal potential zones of support and resistance, suggesting that investors should watch for any price action around these areas. While the current trend remains bullish, potential risks include broader market volatility and sector-specific challenges. Analysts should monitor breaking news and earnings reports that could impact the stock. The technical setup appears favorable, positioning General Dynamics as a solid prospect for portfolio diversification within the aerospace and defense industry.
Smart Data Insight
Master the Perfect Entry & Exit for this Stock
Don't leave your profits to chance. Historically, this stock follows specific seasonal patterns that institutional traders use to maximize returns.
- ✅ Identify the "Golden Buying Window"
- ✅ Avoid high-risk correction cycles
- ✅ Backtested data from the last 20+ years