April 17, 2026 a 03:31 am
GD: Dividend Analysis - General Dynamics Corporation
General Dynamics Corporation, a stalwart in the Aerospace & Defense sector, presents a compelling dividend profile, appealing to income-focused investors. Its dividend history of 49 years marks an exceptional track record of consistent payouts, further elucidated by a stable dividend yield of 1.82%. Despite a modest growth trajectory, the company's dividends remain safe with low payout ratios, showcasing financial discipline amidst fluctuating market conditions.
📊 Overview
The company's standing in the Aerospace & Defense sector is backed by strong financial metrics, evident in its substantial market capitalization and consistent dividend payments. The following table provides a detailed overview of key dividend characteristics:
| Metric | Details |
|---|---|
| Sector | Aerospace & Defense |
| Dividend Yield | 1.82 % |
| Current Dividend per Share | 5.90 USD |
| Dividend History | 49 years |
| Last Cut or Suspension | None |
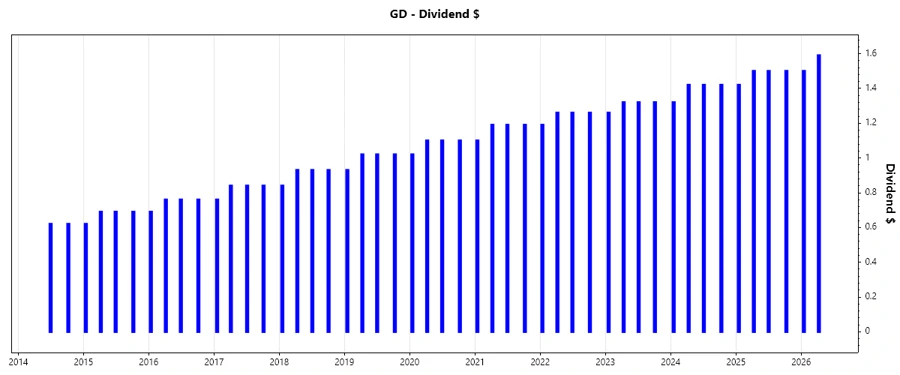
📈 Dividend History
The long-standing dividend history of General Dynamics highlights the company's commitment to returning value to shareholders. This aspect is critical, particularly for investors seeking stable income streams in uncertain markets.
| Year | Dividend per Share |
|---|---|
| 2026 | 3.09 USD |
| 2025 | 5.92 USD |
| 2024 | 5.58 USD |
| 2023 | 5.22 USD |
| 2022 | 4.97 USD |
📊 Dividend Growth
Tracking dividend growth is crucial to forecast future income increases and valuation impacts. General Dynamics shows a modest yet consistent growth rate in dividends over recent years.
| Time | Growth |
|---|---|
| 3 years | 6.00 % |
| 5 years | 6.50 % |
The average dividend growth is 6.50 % over 5 years. This shows moderate but steady dividend growth.
🗣️ Payout Ratio
Maintaining an optimal payout ratio is key for sustainable dividend-paying stocks. General Dynamics has managed to keep its payout ratios relatively low, ensuring that dividends are well covered by earnings and cash flows.
| Key Figure | Ratio |
|---|---|
| EPS-based | 37.84 % |
| Free Cash Flow-based | 40.38 % |
With an EPS-based payout ratio of 37.84 % and a FCF-based ratio of 40.38 %, General Dynamics exhibits prudent dividend policies, balancing growth opportunities with shareholder returns.
🗣️ Cashflow & Capital Efficiency
Effective cash management is the bedrock of a firm's ability to sustain high dividend payouts and undertake strategic investment initiatives. Analyzing cash flow metrics can provide insight into the efficiency and sustainability of these operations.
| Metric | 2023 | 2024 | 2025 |
|---|---|---|---|
| Free Cash Flow Yield | 5.37% | 4.37% | 4.36% |
| Earnings Yield | 4.67% | 5.17% | 4.63% |
| CAPEX to Operating Cash Flow | 0.19 | 0.22 | 0.23 |
| Stock-based Compensation to Revenue | 0.0043 | 0.0038 | 0.0037 |
| Free Cash Flow / Operating Cash Flow Ratio | 0.81 | 0.78 | 0.77 |
General Dynamics shows adequate Free Cash Flow Yield and relatively stable CAPEX spending, indicating efficient capital usage and a healthy cash flow that can back dividend payouts.
📉 Balance Sheet & Leverage Analysis
Evaluating a company's debt structure and liquidity is crucial for understanding potential risks and financial flexibility. Metrics like Debt-to-Equity ratio and Current Ratio help investors assess stability and debt management.
| Metric | 2023 | 2024 | 2025 |
|---|---|---|---|
| Debt-to-Equity | 0.52 | 0.48 | 0.38 |
| Debt-to-Assets | 0.20 | 0.19 | 0.17 |
| Debt-to-Capital | 0.34 | 0.33 | 0.28 |
| Net Debt to EBITDA | 1.75 | 1.54 | 1.22 |
| Current Ratio | 1.44 | 1.37 | 1.44 |
| Quick Ratio | 0.92 | 0.82 | 0.89 |
| Financial Leverage | 2.57 | 2.53 | 2.23 |
The decreasing Debt-to-Equity ratio and a stable Current Ratio highlight General Dynamics' improving financial health and responsibility towards leveraging debt efficiently.
📊 Fundamental Strength & Profitability
Analyzing the company's profitability ratios and returns can reveal the effectiveness of its operations and strategic initiatives. These metrics highlight how well the company drives earnings from investments.
| Metric | 2023 | 2024 | 2025 |
|---|---|---|---|
| Return on Equity | 15.56% | 17.14% | 16.43% |
| Return on Assets | 6.05% | 6.77% | 7.35% |
| Margins: Net | 7.84% | 7.93% | 8.01% |
| EBIT | 10.37% | 10.34% | 10.31% |
| EBITDA | 12.41% | 12.20% | 11.60% |
| Gross | 15.78% | 15.43% | 15.13% |
| Research & Development to Revenue | 1.21% | 1.18% | 0.92% |
Return on equity and asset figures reveal General Dynamics' proficient asset utilization to generate profit. The decline in R&D to revenue ratio signifies increased cost efficiency while maintaining competitive operations.
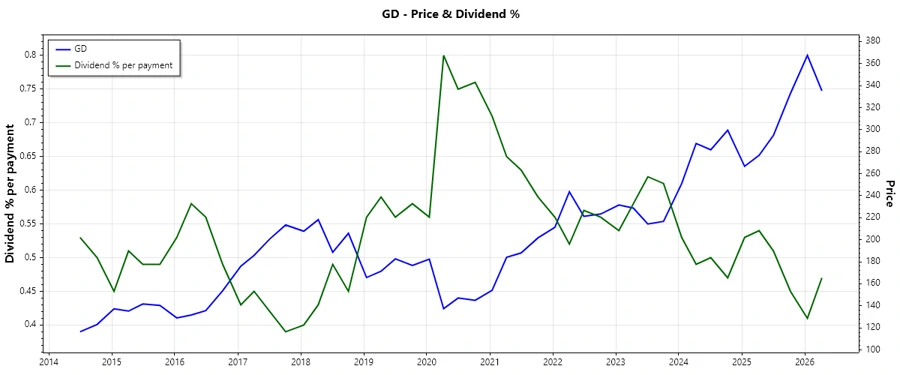
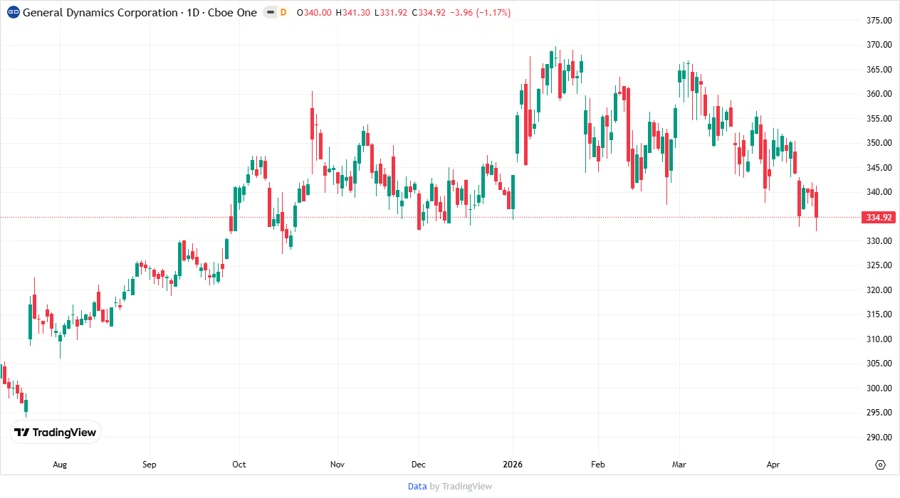
🗣️ Price Development
🔍 Dividend Scoring System
| Category | Score (out of 5) | Score Bar |
|---|---|---|
| Dividend Yield | 3 | |
| Dividend Stability | 5 | |
| Dividend Growth | 3 | |
| Payout Ratio | 4 | |
| Financial Stability | 4 | |
| Dividend Continuity | 5 | |
| Cashflow Coverage | 4 | |
| Balance Sheet Quality | 4 |
Total Score: 32 out of 40
🌟 Rating
General Dynamics Corporation displays a robust dividend profile marked by stability and prudent management, making it a favorable choice for income seekers. With a strong score of 32 out of 40 in our dividend scoring system, the company stands as a reliable investment, offering moderate growth potential while preserving shareholder value. We recommend adding GD to the core of a long-term income-generating portfolio.