June 27, 2025 a 12:46 pm


GD: Dividend Analysis - General Dynamics Corporation
General Dynamics Corporation (GD) presents a robust dividend profile, featuring a solid history of 48 consecutive years of dividend payments without cuts or suspensions. With a current dividend yield of 2.00%, GD demonstrates reliability in shareholder returns. The stable payout ratios and consistent dividend growth underscore GD's commitment to rewarding its shareholders while investing for future growth.
📊 Overview
General Dynamics operates in an industry characterized by substantial contracts and long planning horizons, contributing to its stable financial performance.
| Description | Detail |
|---|---|
| Sector | Defense |
| Dividend yield | 2.00% |
| Current dividend per share | 5.51 USD |
| Dividend history | 48 years |
| Last cut or suspension | None |
📈 Dividend History
General Dynamics' consistent dividend history is a testament to its strong cash flow generation capabilities. This track record builds investor confidence, showcasing the company's stable financial health.
| Year | Dividend per Share (USD) |
|---|---|
| 2025 | 4.42 |
| 2024 | 5.58 |
| 2023 | 5.22 |
| 2022 | 4.97 |
| 2021 | 4.67 |
📊 Dividend Growth
The visible upward trend in General Dynamics' dividend growth indicates its commitment to share its success with shareholders. This is crucial for investors seeking steady income streams that outpace inflation.
| Time | Growth |
|---|---|
| 3 years | 6.11% |
| 5 years | 6.94% |
The average dividend growth is 6.94% over 5 years. This shows moderate but steady dividend growth.
📉 Payout Ratio
The payout ratio gives investors an idea of how much money a company is returning to shareholders. A moderate payout ratio is often seen as a sign of a sustainable dividend.
| Key figure | Ratio |
|---|---|
| EPS-based | 37.28% |
| Free cash flow-based | 44.24% |
With EPS-based and FCF-based payout ratios of 37.28% and 44.24% respectively, General Dynamics has ample room to maintain or increase its dividend.
⚖️ Cashflow & Capital Efficiency
These metrics provide insight into the effectiveness of a company's management in generating cash and efficiently using its capital investments, crucial for long-term stability and growth.
| Metric | 2024 | 2023 | 2022 |
|---|---|---|---|
| Free Cash Flow Yield | 4.37% | 5.37% | 5.07% |
| Earnings Yield | 5.17% | 4.67% | 4.96% |
| CAPEX to Operating Cash Flow | 21.18% | 19.19% | 24.33% |
| Stock-based Compensation to Revenue | 0.38% | 0.43% | 0.42% |
| Free Cash Flow / Operating Cash Flow Ratio | 77.72% | 80.81% | 75.67% |
General Dynamics demonstrates positive cash flow metrics suggesting sound capital efficiency and a strong foundation for steady dividends.
📉 Balance Sheet & Leverage Analysis
Evaluate the company’s financial stability, looking at leverage and liquidity, which signal how well a company can manage its debt and sustain operations during tough times.
| Metric | 2024 | 2023 | 2022 |
|---|---|---|---|
| Debt-to-Equity | 48.39% | 52.04% | 56.53% |
| Debt-to-Assets | 19.11% | 20.22% | 20.35% |
| Net Debt to EBITDA | 1.54x | 1.75x | 1.74x |
| Financial Leverage | 2.53x | 2.57x | 2.78x |
These ratios highlight General Dynamics' effective use of leverage, with managed debt levels relative to equity, assets, and earnings, showcasing financial robustness.
📈 Fundamental Strength & Profitability
This analysis looks at profitability ratios and efficiency metrics, indicating how well a company generates returns on investments and revenue from operations.
| Metric | 2024 | 2023 | 2022 |
|---|---|---|---|
| Return on Equity | 17.14% | 15.56% | 18.26% |
| Return on Assets | 6.77% | 6.05% | 6.57% |
| EBIT Margin | 10.34% | 10.37% | 11.23% |
| R&D to Revenue | 2.03% | 1.21% | 1.22% |
General Dynamics' return on equity and margins suggest solid profitability and effective cost management, essential for long-term growth and shareholder value.
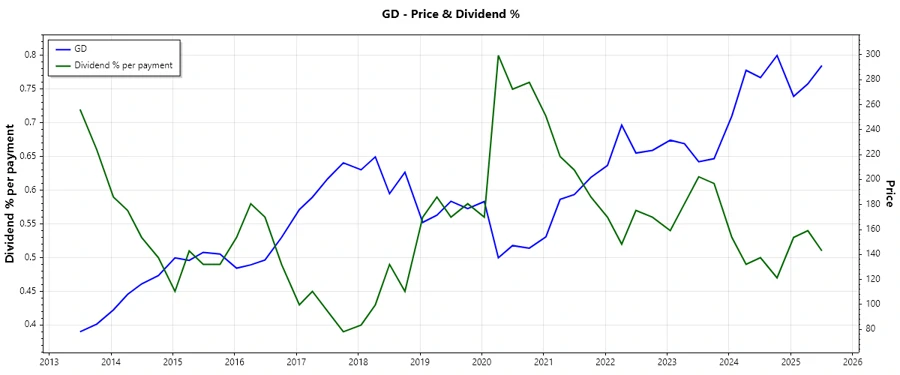
💹 Price Development
🔍 Dividend Scoring System
| Criterion | Score | |
|---|---|---|
| Dividend yield | 4 | |
| Dividend Stability | 5 | |
| Dividend growth | 3 | |
| Payout ratio | 4 | |
| Financial stability | 5 | |
| Dividend continuity | 5 | |
| Cashflow Coverage | 4 | |
| Balance Sheet Quality | 4 |
Total Score: 34/40
🏅 Rating
General Dynamics Corporation exhibits an admirable dividend profile supported by robust fundamentals, making it a commendable choice for dividend-seeking investors. With consistent dividend growth, stable payout ratios, and strong financial efficiency, GD is well-positioned to continue delivering shareholder value. Investors are recommended to consider GD as a reliable addition to a diversified dividend portfolio.
Smart Data Insight
Master the Perfect Entry & Exit for this Stock
Don't leave your profits to chance. Historically, this stock follows specific seasonal patterns that institutional traders use to maximize returns.
- ✅ Identify the "Golden Buying Window"
- ✅ Avoid high-risk correction cycles
- ✅ Backtested data from the last 20+ years