May 17, 2026 a 02:03 pm
GDDY: Trend and Support & Resistance Analysis - GoDaddy Inc.
GoDaddy Inc., a company focused on cloud-based technology products, has shown varied movements in its stock prices. Patients and detailed observation is crucial to tap into this company's financial annals. As a stock that caters to the digital domain, its positioning during the technological boom makes it a point of interest for investors. Recent analysis suggests a potential shift in trends, warranting cautious optimism for those looking for long-term gains.
Trend Analysis
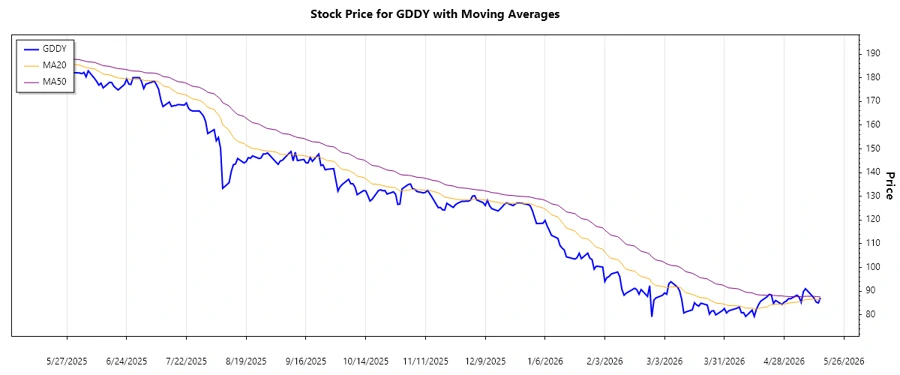
The analysis of GDDY stock prices over the recent period reveals a transition primarily highlighted by the movement between EMA20 and EMA50. These indicators provide insights into the stock's direction.
| Date | Close Price | Trend |
|---|---|---|
| 2026-05-15 | 87.18 | ▲ Upward |
| 2026-05-14 | 84.97 | ▼ Downward |
| 2026-05-13 | 85.38 | ↔ Sideways |
| 2026-05-12 | 87.03 | ▲ Upward |
| 2026-05-11 | 88.08 | ▲ Upward |
| 2026-05-08 | 91.02 | ▲ Upward |
| 2026-05-07 | 89.75 | ▼ Downward |
The EMA analysis over the observed period shows fluctuations, with EMA20 occasionally rising above EMA50. Inference suggests a short-term upward trend with intermittent declines. Vigilance in market responses is advised for adaptive trading strategies.
Support and Resistance
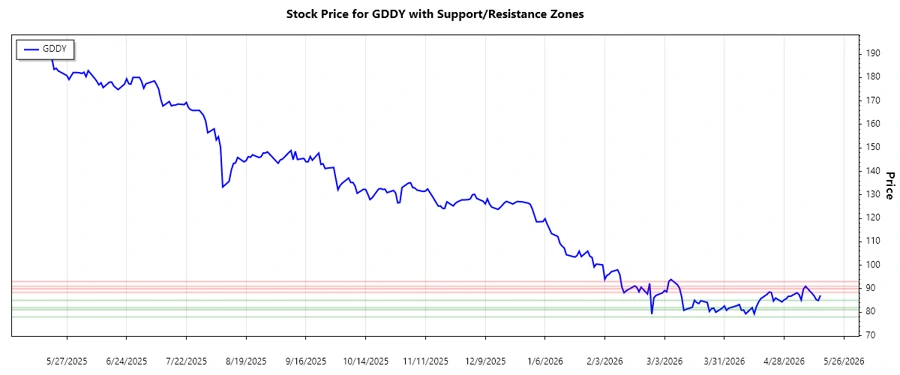
Identifying critical support and resistance levels provides investors with potential exit and entry strategies. The analysis reveals the following zones in stock pricing:
| Support Zone | Price Range | Trend |
|---|---|---|
| Zone 1 | 81.95 - 85.00 | ↘ Weakening |
| Zone 2 | 78.00 - 81.00 | ↘ Weakening |
| Resistance Zone | Price Range | Trend |
|---|---|---|
| Zone 1 | 88.50 - 90.00 | ↗ Strengthening |
| Zone 2 | 91.00 - 93.00 | ↗ Strengthening |
The current stock price positions itself amidst a critical resistance zone, suggesting potential for either a breakout or retreat. Investors must observe closely as price tests these levels for momentum shifts.
Conclusion
The GoDaddy Inc. stock analysis signifies a complex interplay between upward and downward pressures. The trend remains tentatively bullish with intermittent downturns. As the market tests key resistance levels, shifts in investor strategies could lead to significant movements. For those alert to market nuances, opportunities abound amidst these dynamic patterns. Cautious optimism is suggested for medium-term positioning, complemented by flexible risk management strategies.
json This analysis provides an overview of GoDaddy Inc.'s stock performance using recent data. It highlights trends through a thorough EMA analysis and provides insights into support and resistance zones. This structured approach helps in understanding potential market movements.
Smart Data Insight
Master the Perfect Entry & Exit for this Stock
Don't leave your profits to chance. Historically, this stock follows specific seasonal patterns that institutional traders use to maximize returns.
- ✅ Identify the "Golden Buying Window"
- ✅ Avoid high-risk correction cycles
- ✅ Backtested data from the last 20+ years