October 09, 2025 a 09:03 am
GDDY: Trend and Support & Resistance Analysis - GoDaddy Inc.
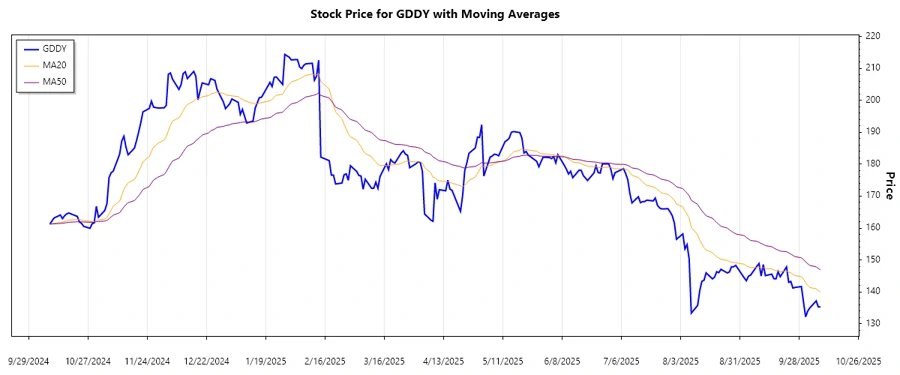
GoDaddy Inc., a prominent player in the cloud-based technology sector, has exhibited a varied stock price movement over the past months. Recent data indicates a noticeable downward trend, suggesting cautious investment strategies for short-term investors. Conversely, long-term prospects remain positive due to the company's robust portfolio and global reach. Investors should monitor technical indicators closely, especially EMA trends, to make informed decisions.
Trend Analysis
| Date | Close Price | Trend |
|---|---|---|
| 2025-10-08 | 135.3 | 🔻 |
| 2025-10-07 | 135.27 | 🔻 |
| 2025-10-06 | 137.19 | 🔻 |
| 2025-10-03 | 135 | 🔻 |
| 2025-10-02 | 134 | 🔻 |
| 2025-10-01 | 132.18 | 🔻 |
| 2025-09-30 | 136.83 | 🔻 |
The EMA20 and EMA50 analysis indicates a pronounced downward trend (EMA20 < EMA50). This suggests selling pressure, which investors might interpret as a cautionary sign.
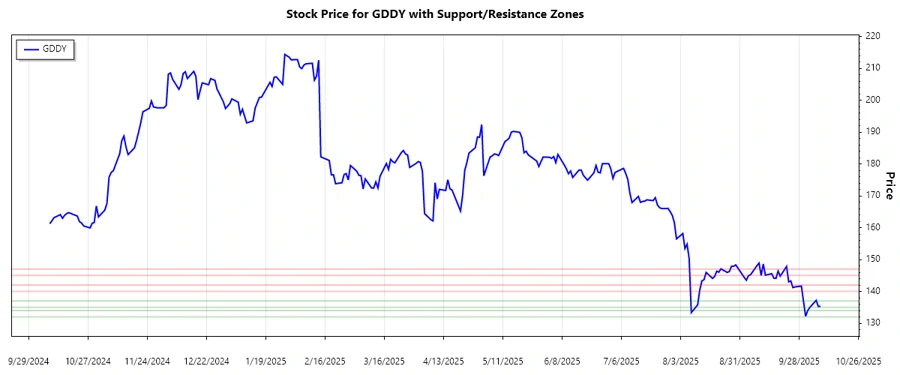
Support- and Resistance
| Zone Type | Price Range | Status |
|---|---|---|
| Support 1 | 135.00 - 137.00 | ⬇️ Current Price Below |
| Support 2 | 132.00 - 134.00 | ⬆️ Approaching |
| Resistance 1 | 140.00 - 142.00 | ⬆️ Overhead |
| Resistance 2 | 145.00 - 147.00 | ⬆️ Far Above |
The current price appears to be nearing the second support zone, with potential for a bounce. Yet, consistent violations could signal further decline.
Conclusion
GoDaddy's recent technical indicators point toward a downward trend, emphasizing the need for caution among short-term investors. However, the upcoming support zones could provide strategic entry points should a reversal signal appear. Investors should weigh the risks of further declines against potential recoveries driven by the company's long-term business strategy. Continued observation of market reactions to support/resistance zones is recommended for making astute investment choices.
Smart Data Insight
Master the Perfect Entry & Exit for this Stock
Don't leave your profits to chance. Historically, this stock follows specific seasonal patterns that institutional traders use to maximize returns.
- ✅ Identify the "Golden Buying Window"
- ✅ Avoid high-risk correction cycles
- ✅ Backtested data from the last 20+ years