August 14, 2025 a 01:15 pm


GDDY: Trend and Support & Resistance Analysis - GoDaddy Inc.
GoDaddy Inc. has been a leading entity in the cloud-based technology market, particularly known for its domain registration and web hosting services. Recent stock performances have shown fluctuations reflective of market conditions, capturing investor interest. Analyzing recent trends will provide insights into potential stock movements and strategic entry or exit points for investors.
Trend Analysis
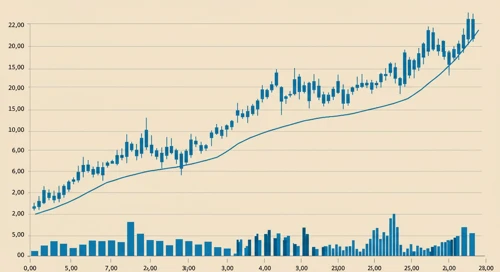
The analysis of GoDaddy Inc. (GDDY) over the past several months highlights a developing trend. We computed the Exponential Moving Averages (EMA) over the last 20 and 50 days to understand the trend direction.
| Date | Closing Price | Trend Direction |
|---|---|---|
| 2025-08-13 | $143.32 | ▼ Downtrend |
| 2025-08-12 | $140.41 | ▼ Downtrend |
| 2025-08-11 | $135.77 | ▼ Downtrend |
| 2025-08-08 | $133.35 | ▼ Downtrend |
| 2025-08-07 | $150.25 | ▼ Downtrend |
| 2025-08-06 | $154.82 | ▼ Downtrend |
| 2025-08-05 | $153.43 | ▼ Downtrend |
Given recent data, the EMA20 is below the EMA50 indicating a potential downward trend that investors should consider as significant for making informed decisions.
Support and Resistance
Through analysis of historical data, we establish key support and resistance zones that could guide future price movements.
| Zone Type | Lower Bound | Upper Bound | Trend |
|---|---|---|---|
| Support | $135.00 | $140.00 | 🟢 Strong Support |
| Support | $145.00 | $150.00 | 🟢 Moderate Support |
| Resistance | $155.00 | $160.00 | 🔴 Moderate Resistance |
| Resistance | $165.00 | $170.00 | 🔴 Strong Resistance |
The current price is hovering in a support zone, indicating the potential for a bounce or further decline depending on market sentiment and external factors. Investors should watch for breakout confirmations.
Conclusion
The GoDaddy Inc. stock is currently experiencing a downtrend as indicated by the EMA analysis. Nonetheless, with clearly defined support zones, there are potential opportunities for value-driven investors who are considering positions at lower price points. Market participants should keep an eye on these levels and watch for any signs of breakouts from the current resistances that could indicate a trend reversal. The dynamic nature of the tech market continues to present both risks in terms of volatility and opportunities for revenue growth driven by innovation.
Smart Data Insight
Master the Perfect Entry & Exit for this Stock
Don't leave your profits to chance. Historically, this stock follows specific seasonal patterns that institutional traders use to maximize returns.
- ✅ Identify the "Golden Buying Window"
- ✅ Avoid high-risk correction cycles
- ✅ Backtested data from the last 20+ years