
June 17, 2026 a 05:15 am

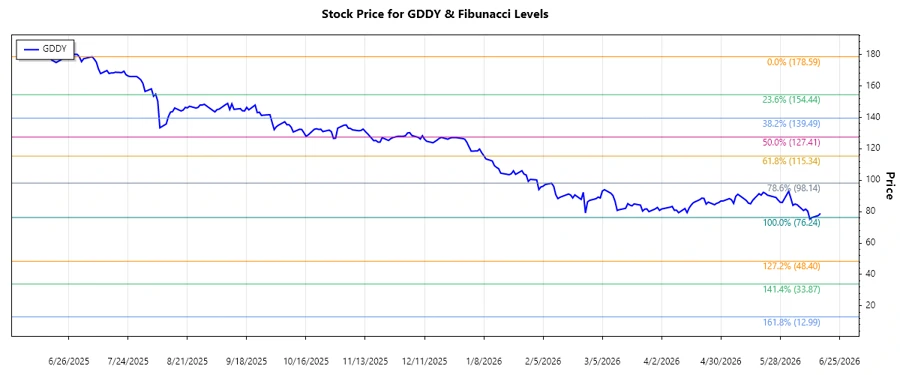
GDDY: Fibonacci Analysis - GoDaddy Inc.
GoDaddy Inc., with its strong presence in the domain registration and web hosting market, has demonstrated resilient growth despite facing challenges in the cloud-based solutions sector. Recent stock performance suggests a correction phase following a previously noticeable downtrend, making it crucial for investors to consider potential support levels. Understanding current price dynamics within the broader market context can provide opportunities for strategic buying decisions.
Fibonacci Analysis
The presented analysis utilizes the recently identified downward trend in GoDaddy Inc. shares, starting from a high of $178.59 on July 7, 2025, to a low of $76.24 on June 12, 2026. This analysis is aimed at using the Fibonacci Retracement Levels to pinpoint potential price movements and identify relevant support and resistance levels.
| Parameter | Information |
|---|---|
| Trend Start Date | 2025-07-07 |
| Trend End Date | 2026-06-12 |
| High Price | $178.59 (2025-07-07) |
| Low Price | $76.24 (2026-06-12) |
| Fibonacci Level 0.236 | $104.207 |
| Fibonacci Level 0.382 | $118.212 |
| Fibonacci Level 0.5 | $127.415 |
| Fibonacci Level 0.618 | $136.618 |
| Fibonacci Level 0.786 | $151.858 |
The current price is $78.83, which is yet to reach any significant Fibonacci retracement level, indicating it remains in a downward trajectory.
This technical positioning suggests the stock might be looking for a stable support level, and a bounce-back from one of the key Fibonacci levels could initiate a buying opportunity.
Conclusion
GoDaddy appears to be in a transformative phase, as the current price action suggests a search for bottom support. The next potential resistance zones are marked by the Fibonacci retracement levels, which could offer reversal points. Analyst outlook remains cautiously optimistic; if significant support can be established, there is potential for gradual recovery. However, should the current downward pressure continue, investors are advised to monitor the broader market trends along with GoDaddy's strategic initiatives in order to minimize potential risks.
Smart Data Insight
Master the Perfect Entry & Exit for this Stock
Don't leave your profits to chance. Historically, this stock follows specific seasonal patterns that institutional traders use to maximize returns.
- ✅ Identify the "Golden Buying Window"
- ✅ Avoid high-risk correction cycles
- ✅ Backtested data from the last 20+ years