February 19, 2026 a 10:15 am

GDDY: Fibonacci Analysis - GoDaddy Inc.
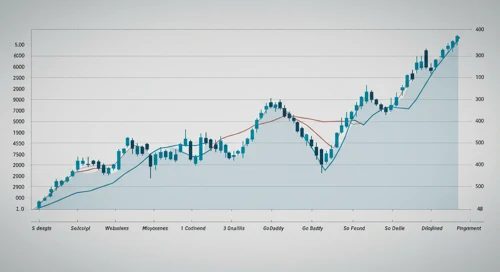
GoDaddy Inc. has shown a significant downward trend over recent months, reflecting a decrease in investor confidence amidst broader market challenges. This decline positions GoDaddy as an appealing opportunity for potential recovery, particularly for investors seeking value stocks. However, caution is advised, given current market volatility and competitive pressures within the cloud-based technology sector.
Fibonacci Analysis
| Detail | Value |
|---|---|
| Start Date of Trend | 2025-07-28 |
| End Date of Trend | 2026-02-18 |
| High Price and Date | $169.40 on 2025-07-22 |
| Low Price and Date | $88.26 on 2026-02-12 |
| Fibonacci Levels |
|
| Current Price | $90.56 (as of 2026-02-18) |
| Current Retracement Zone | none |
| Interpretation | The current price is below the Fibonacci retracement levels, indicating potential for future upward correction as it broke through the lower boundaries. |
Conclusion
GoDaddy Inc.'s stock has experienced a marked downtrend, reaching significantly low prices as shown in our analysis. The current trading price suggests an opportunity for a rebound, according to Fibonacci retracement levels. While this may indicate a potential support zone, investors should remain cautious of macroeconomic influences and competitive industry dynamics. There is a sizeably attractive potential for those seeking growth in a fundamentally strong underlying business, yet the associated risks, including sector competition and market instability, necessitate a meticulous approach. For analysts, the retracement levels propose observable targets for potential price corrections or reversals in the coming months.
JSON Representation: