CL: Analysts Ratings - Colgate Palmolive Company
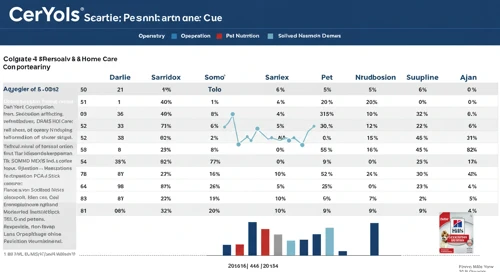
CL: Comprehensive breakdown of current and historical analyst ratings, offering insights into how expert sentiment has evolved over time.
July 21, 2026 a 05:00 pm
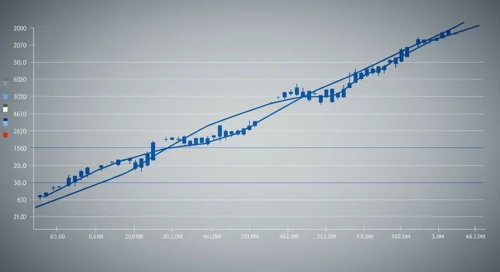
PTC: Fibunacci Level Technical Analysis - PTC Inc
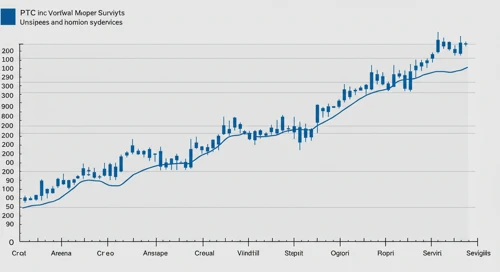
PTC: Fibonacci retracement levels to identify key potential support and resistance zones, based on recent price trends.
July 21, 2026 a 04:44 pm
IQV: Analysts Ratings - IQVIA Holdings Inc
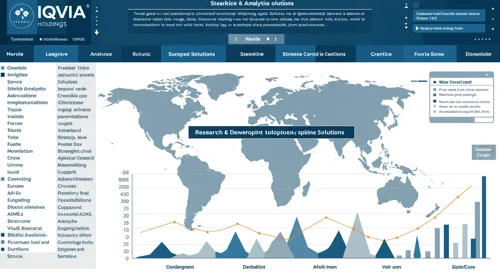
IQV: Comprehensive breakdown of current and historical analyst ratings, offering insights into how expert sentiment has evolved over time.
July 21, 2026 a 04:38 pm
CCL: Fundamental Ratio Analysis - Carnival Corporation and plc
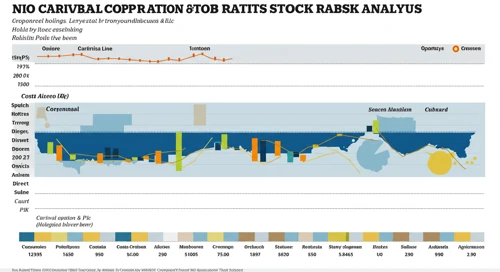
CCL: Evaluation of key financial ratios, analyst ratings, and price targets. A data-driven perspective on the valuation and market expectations.
July 21, 2026 a 03:43 pm
PG: Dividend Analysis - The Procter and Gamble Company

PG: In-depth analysis of a company's dividend stability and key fundamental ratios to assess its financial strength and long-term investment potential.
July 21, 2026 a 03:31 pm
Utilities Comparison. 21 Jul

Comparison of Utilities. Where is strength and weakness? What has developed well and badly?
July 21, 2026 a 03:16 pm
ODFL: Fibunacci Level Technical Analysis - Old Dominion Freight Line Inc
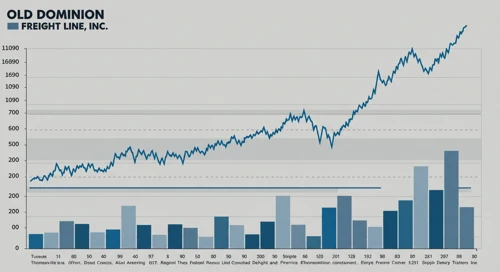
ODFL: Fibonacci retracement levels to identify key potential support and resistance zones, based on recent price trends.
July 21, 2026 a 03:15 pm
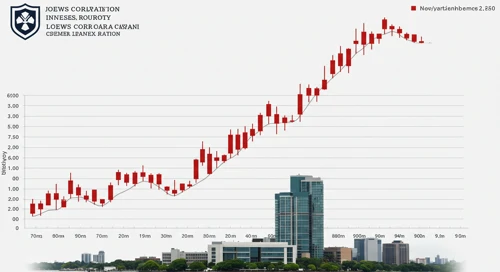
L: Analysts Ratings - Loews Corporation
July 21, 2026 a 08:38 pm
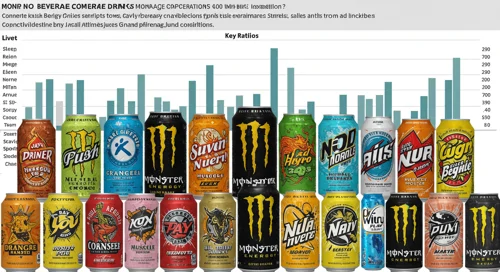
MNST: Fundamental Ratio Analysis - Monster Beverage Corporation
July 21, 2026 a 07:43 pm
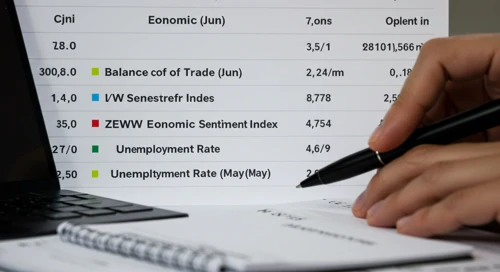
Todays Important Key Figures 21 Jul
July 21, 2026 a 07:00 pm
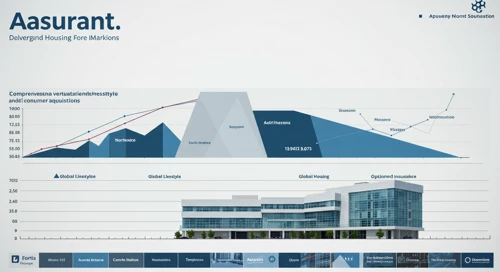
AIZ: Fundamental Ratio Analysis - Assurant Inc
July 21, 2026 a 06:00 pm
AEP: Trend with Support and Resistance Levels - American Electric Power Company Inc
AEP: Current price trend is evaluated alongside key support and resistance level. View of potential turning points and price momentum.
July 21, 2026 a 02:03 pm
JPM: Trend with Support and Resistance Levels - JPMorgan Chase and Co
JPM: Current price trend is evaluated alongside key support and resistance level. View of potential turning points and price momentum.
July 21, 2026 a 01:15 pm
INVH: Analysts Ratings - Invitation Homes Inc
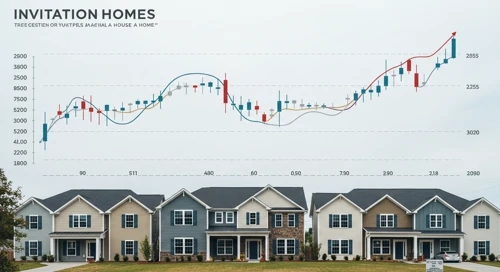
INVH: Comprehensive breakdown of current and historical analyst ratings, offering insights into how expert sentiment has evolved over time.
July 21, 2026 a 01:00 pm
AXON: Fundamental Ratio Analysis - Axon Enterprise Inc
AXON: Evaluation of key financial ratios, analyst ratings, and price targets. A data-driven perspective on the valuation and market expectations.
July 21, 2026 a 01:00 pm
ETN: Dividend Analysis - Eaton Corporation plc
ETN: In-depth analysis of a company's dividend stability and key fundamental ratios to assess its financial strength and long-term investment potential.
July 21, 2026 a 12:46 pm
OXY: Analysts Ratings - Occidental Petroleum Corporation

OXY: Comprehensive breakdown of current and historical analyst ratings, offering insights into how expert sentiment has evolved over time.
July 21, 2026 a 12:39 pm
Commodities Comparison. 21 Jul
Comparison of Commodities. Where is strength and weakness? What has developed well and badly?
July 21, 2026 a 12:31 pm
Stock Market - Heatmap
Use mouse wheel to zoom in and out. Click a ticker to display detailed information in a new window. Hover mouse cursor over a ticker to see more data.
Stock's
EFX: Trend with Support and Resistance Levels - Equifax Inc
EFX: Current price trend is evaluated alongside key support and resistance level. View of potential turning points and price momentum.
July 21, 2026 a 09:03 am
NTRS: Analysts Ratings - Northern Trust Corporation
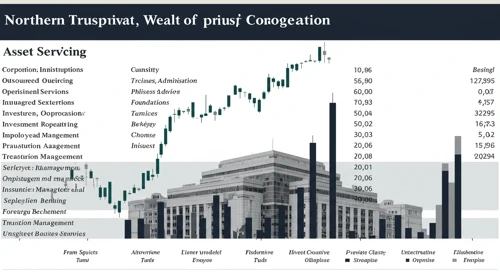
NTRS: Comprehensive breakdown of current and historical analyst ratings, offering insights into how expert sentiment has evolved over time.
July 21, 2026 a 09:00 am
RMD: Analysts Ratings - ResMed Inc

RMD: Comprehensive breakdown of current and historical analyst ratings, offering insights into how expert sentiment has evolved over time.
July 21, 2026 a 08:38 am
DUK: Trend with Support and Resistance Levels - Duke Energy Corporation
DUK: Current price trend is evaluated alongside key support and resistance level. View of potential turning points and price momentum.
July 21, 2026 a 08:15 am
EXR: Fundamental Ratio Analysis - Extra Space Storage Inc
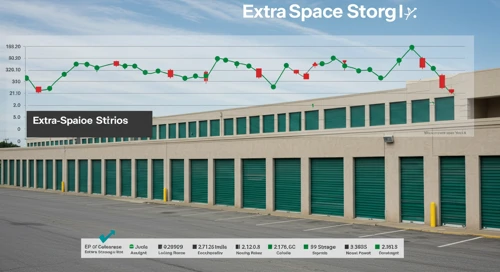
EXR: Evaluation of key financial ratios, analyst ratings, and price targets. A data-driven perspective on the valuation and market expectations.
July 21, 2026 a 08:00 am
MDT: Fundamental Ratio Analysis - Medtronic plc

MDT: Evaluation of key financial ratios, analyst ratings, and price targets. A data-driven perspective on the valuation and market expectations.
July 21, 2026 a 07:43 am
AIG: Dividend Analysis - American International Group Inc
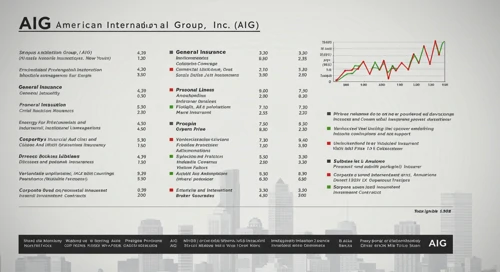
AIG: In-depth analysis of a company's dividend stability and key fundamental ratios to assess its financial strength and long-term investment potential.
July 21, 2026 a 07:31 am
TAP: Fibunacci Level Technical Analysis - Molson Coors Beverage Company
July 21, 2026 a 11:44 am
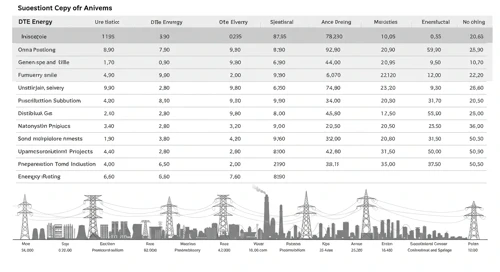
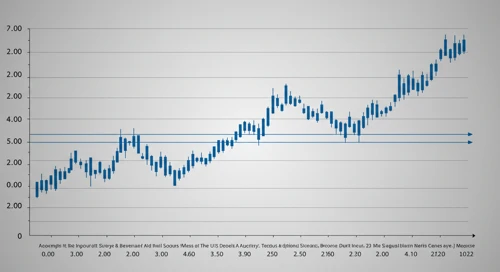
DTE: Fundamental Ratio Analysis - DTE Energy Company
July 21, 2026 a 11:43 am

RSG: Dividend Analysis - Republic Services Inc
July 21, 2026 a 11:31 am
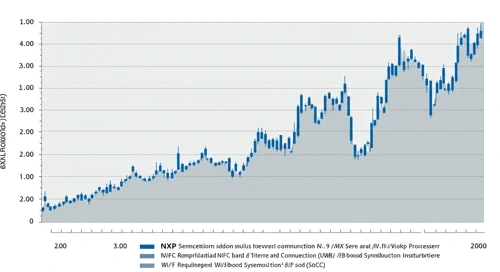
NXPI: Fibunacci Level Technical Analysis - NXP Semiconductors NV
July 21, 2026 a 10:15 am
PNC: Fibunacci Level Technical Analysis - The PNC Financial Services Group Inc
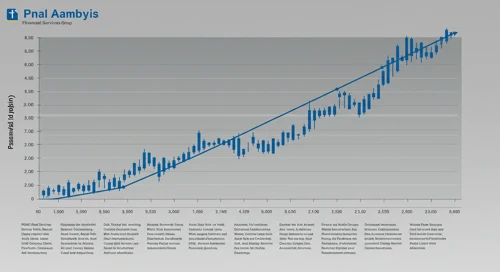
PNC: Fibonacci retracement levels to identify key potential support and resistance zones, based on recent price trends.
July 21, 2026 a 06:44 am
JPM: Fibunacci Level Technical Analysis - JPMorgan Chase and Co
JPM: Fibonacci retracement levels to identify key potential support and resistance zones, based on recent price trends.
July 21, 2026 a 05:15 am
NWS: Dividend Analysis - News Corporation
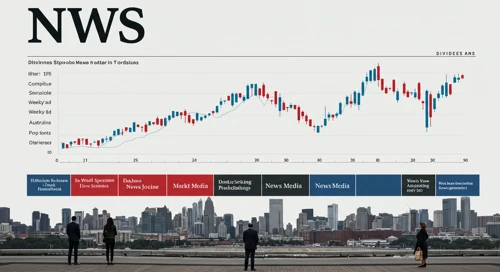
NWS: In-depth analysis of a company's dividend stability and key fundamental ratios to assess its financial strength and long-term investment potential.
July 21, 2026 a 03:30 am
HAS: Trend with Support and Resistance Levels - Hasbro Inc
HAS: Current price trend is evaluated alongside key support and resistance level. View of potential turning points and price momentum.
July 21, 2026 a 03:15 am
VZ: Analysts Ratings - Verizon Communications Inc
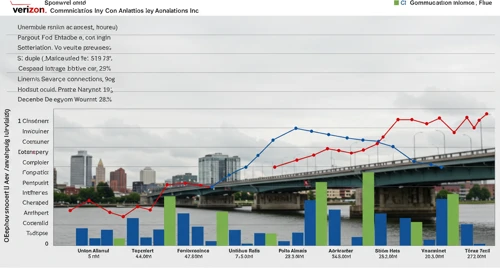
VZ: Comprehensive breakdown of current and historical analyst ratings, offering insights into how expert sentiment has evolved over time.
July 20, 2026 a 09:00 pm
MMC: Analysts Ratings - Marsh and McLennan Companies Inc

MMC: Comprehensive breakdown of current and historical analyst ratings, offering insights into how expert sentiment has evolved over time.
July 20, 2026 a 08:38 pm
SRE: Fundamental Ratio Analysis - Sempra
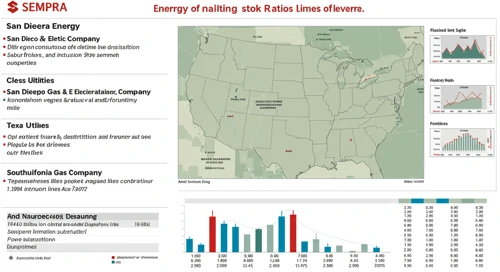
SRE: Evaluation of key financial ratios, analyst ratings, and price targets. A data-driven perspective on the valuation and market expectations.
July 20, 2026 a 07:43 pm
Economic Calendar
Currencies
EURCHF: Fibunacci Level Technical Analysis
EURCHF: Fibonacci retracement levels to identify key potential support and resistance zones, based on recent price trends.
July 20, 2026 a 05:08 am
EURUSD: Trend with Support and Resistance Levels
EURUSD: Current price trend is evaluated alongside key support and resistance level. View of potential turning points and price momentum.
July 20, 2026 a 04:28 am
GBPAUD: Fibunacci Level Technical Analysis
GBPAUD: Fibonacci retracement levels to identify key potential support and resistance zones, based on recent price trends.
July 19, 2026 a 05:08 am
GBPNZD: Trend with Support and Resistance Levels
GBPNZD: Current price trend is evaluated alongside key support and resistance level. View of potential turning points and price momentum.
July 19, 2026 a 04:28 am
GBPCAD: Fibunacci Level Technical Analysis
GBPCAD: Fibonacci retracement levels to identify key potential support and resistance zones, based on recent price trends.
July 18, 2026 a 05:08 am
NZDCAD: Trend with Support and Resistance Levels
NZDCAD: Current price trend is evaluated alongside key support and resistance level. View of potential turning points and price momentum.
July 18, 2026 a 04:28 am
Todays Important Key Figures 18 Jul
Today’s important economic data releases – a snapshot of key indicators influencing markets and shaping financial expectations.
July 17, 2026 a 11:00 pm
GBPJPY: Fibunacci Level Technical Analysis
July 21, 2026 a 05:08 am
AUDUSD: Trend with Support and Resistance Levels
July 21, 2026 a 04:28 am

Important Key Figures of the last Days
July 21, 2026 a 02:31 am

Todays Important Key Figures 20 Jul
July 20, 2026 a 07:00 pm
Todays Important Key Figures 17 Jul

Today’s important economic data releases – a snapshot of key indicators influencing markets and shaping financial expectations.
July 17, 2026 a 07:00 pm
GBPUSD: Fibunacci Level Technical Analysis
GBPUSD: Fibonacci retracement levels to identify key potential support and resistance zones, based on recent price trends.
July 17, 2026 a 05:08 am
CHFJPY: Trend with Support and Resistance Levels
CHFJPY: Current price trend is evaluated alongside key support and resistance level. View of potential turning points and price momentum.
July 17, 2026 a 04:28 am
Todays Important Key Figures 16 Jul
Today’s important economic data releases – a snapshot of key indicators influencing markets and shaping financial expectations.
July 16, 2026 a 07:00 pm
CADJPY: Fibunacci Level Technical Analysis
CADJPY: Fibonacci retracement levels to identify key potential support and resistance zones, based on recent price trends.
July 16, 2026 a 05:08 am
EURAUD: Trend with Support and Resistance Levels
EURAUD: Current price trend is evaluated alongside key support and resistance level. View of potential turning points and price momentum.
July 16, 2026 a 04:28 am
Important Key Figures of the last Days

Overview of key economic indicators released over the past days, highlighting their potential impact on markets and investor sentiment.
July 16, 2026 a 02:31 am
Currencies