
September 24, 2026 a 04:28 am

GBPUSD: Trend and Support & Resistance Analysis
The recent analysis of GBPUSD reveals a prevailing trend in the currency market. Understanding these patterns is crucial for making informed trading decisions. This report will delve into the trend dynamics and identify key support and resistance zones to guide traders in navigating the complex currency landscape.
Trend Analysis
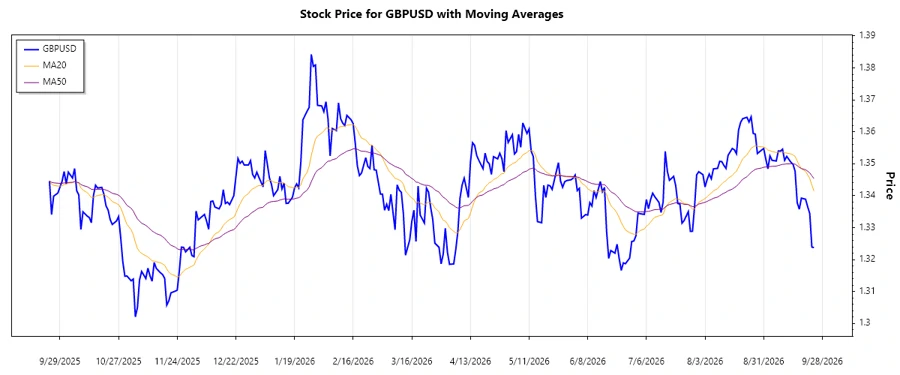
Upon reviewing the recent daily closing prices of GBPUSD, we calculate the EMA20 and EMA50. These calculations show that the EMA20 is consistently below the EMA50 over the recent period, indicating a dominant downward trend. Here is a detailed tabulation of the most recent seven trading days:
| Date | Closing Price | Trend |
|---|---|---|
| 2026-09-24 | 1.32374 | ▼ |
| 2026-09-23 | 1.32391 | ▼ |
| 2026-09-22 | 1.33438 | ▼ |
| 2026-09-21 | 1.33654 | ▼ |
| 2026-09-20 | 1.33888 | ▼ |
| 2026-09-18 | 1.33923 | ▼ |
| 2026-09-17 | 1.33577 | ▼ |
The observable downtrend suggests caution for traders anticipating rebounds or reversals. Continued monitoring and analysis of EMA trends remain critical.
Support and Resistance
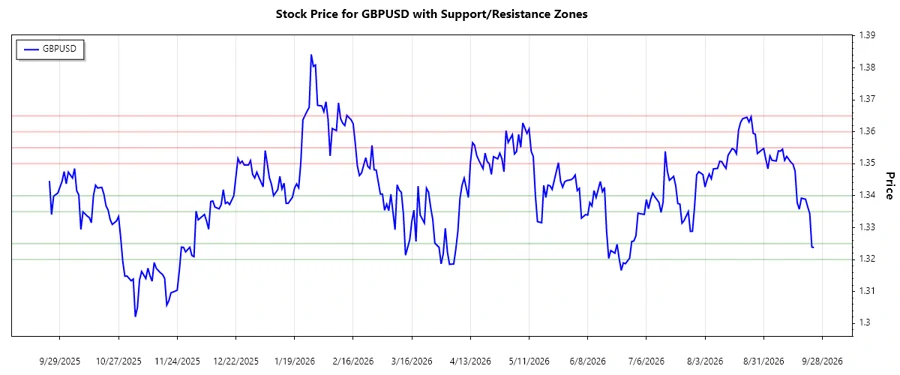
The calculated support and resistance zones are derived from recent price movements. The following table highlights these zones:
| Zone | From | To |
|---|---|---|
| Support 1 | 1.32000 | 1.32500 |
| Support 2 | 1.33500 | 1.34000 |
| Resistance 1 | 1.35000 | 1.35500 |
| Resistance 2 | 1.36000 | 1.36500 |
The current price of GBPUSD appears to be nearing the lower support zone. This may signal a potential area for buyers, though the overall trend suggests careful consideration.
Conclusion
The GBPUSD remains in a pronounced downtrend, as indicated by recent EMA analysis and closing price evaluations. While support and resistance zones provide strategic markers for potential market entry and exit points, traders should remain cautious, mindful of the prevailing downtrend. Opportunities may arise from these zones, but risks remain significant given the current market conditions.
Smart Data Insight
Master the Perfect Entry & Exit for this Stock
Don't leave your profits to chance. Historically, this stock follows specific seasonal patterns that institutional traders use to maximize returns.
- ✅ Identify the "Golden Buying Window"
- ✅ Avoid high-risk correction cycles
- ✅ Backtested data from the last 20+ years