
June 16, 2026 a 04:28 am

GBPUSD: Trend and Support & Resistance Analysis
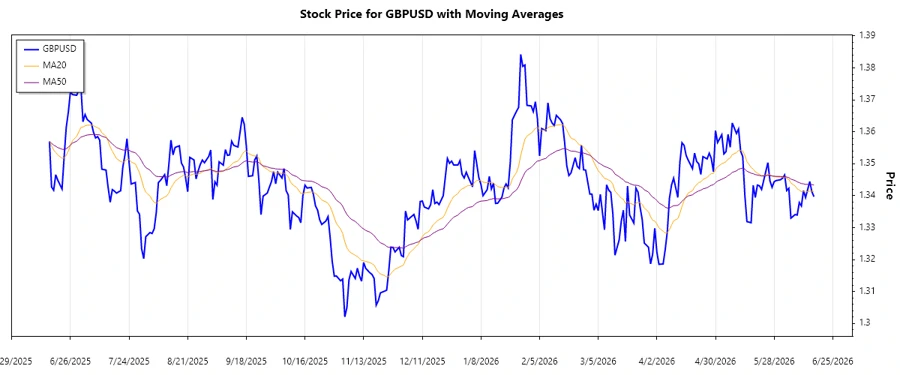
The GBPUSD currency pair has exhibited a mix of volatility and stability over the past few months. With a fluctuating market dynamic, understanding the underlying trend and crucial support and resistance levels in this pair is vital. The analysis here provides insights into the recent movements, highlighting potential trading opportunities based on calculated exponential moving averages. The observed trends suggest potential zones that traders need to watch closely.
Trend Analysis
The GBPUSD has shown varied momentum patterns with shifts in trend evident from the calculated EMAs. Specifically, the comparison between EMA20 and EMA50 allows for a detection of clear directional trends:
| Date | Close Price | Trend |
|---|---|---|
| 2026-06-16 | 1.33968 | ▼ Downtrend |
| 2026-06-15 | 1.34124 | ▶️ Sideways |
| 2026-06-14 | 1.34444 | ▲ Uptrend |
| 2026-06-12 | 1.33942 | ▼ Downtrend |
| 2026-06-11 | 1.34158 | ▲ Uptrend |
| 2026-06-10 | 1.33678 | ▼ Downtrend |
| 2026-06-09 | 1.33785 | ▶️ Sideways |
In conclusion, the GBPUSD trend indicates the potential for further sideways trading with breakout opportunities. The current cross of EMA20 over EMA50 suggests an emerging uptrend that could gain momentum.
Support- and Resistance
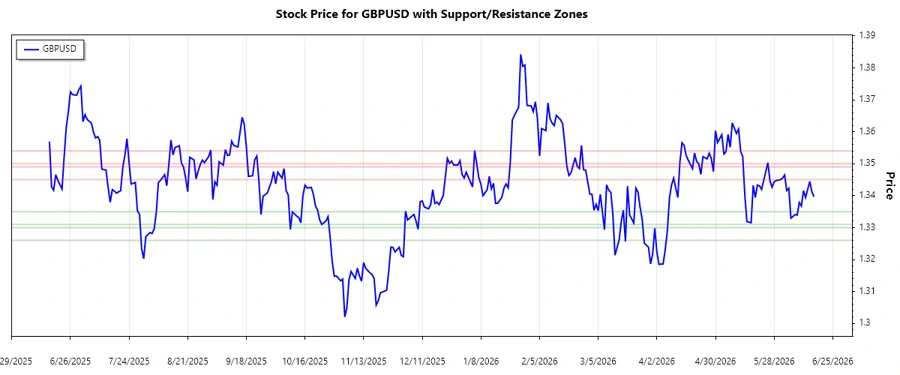
Through close price analysis, key support and resistance levels have been identified, offering traders crucial entry and exit points:
| Zone Type | From | To |
|---|---|---|
| Support 1 | 1.33100 | 1.33500 |
| Support 2 | 1.32600 | 1.33000 |
| Resistance 1 | 1.34500 | 1.34900 |
| Resistance 2 | 1.35000 | 1.35400 |
The current price range is close to the first resistance zone, indicating a potential test of this level. A breakthrough could pave the way for a more pronounced uptrend, while failure to break through might suggest a reversion to support levels.
Conclusion
In summary, the GBPUSD exchange rate has demonstrated a potential for breakout movements as shown by its proximity to resistance levels. Traders should watch for signals indicating trend strengthening, especially if the EMA20 maintains above EMA50. Risks involve potential reversals at support levels, but opportunities for gains are also present if bullish patterns prevail. Technical indicators highlight the significance of maintaining vigilance around these key levels for informed trading decisions.
Smart Data Insight
Master the Perfect Entry & Exit for this Stock
Don't leave your profits to chance. Historically, this stock follows specific seasonal patterns that institutional traders use to maximize returns.
- ✅ Identify the "Golden Buying Window"
- ✅ Avoid high-risk correction cycles
- ✅ Backtested data from the last 20+ years