December 12, 2025 a 04:28 am


GBPUSD: Trend and Support & Resistance Analysis
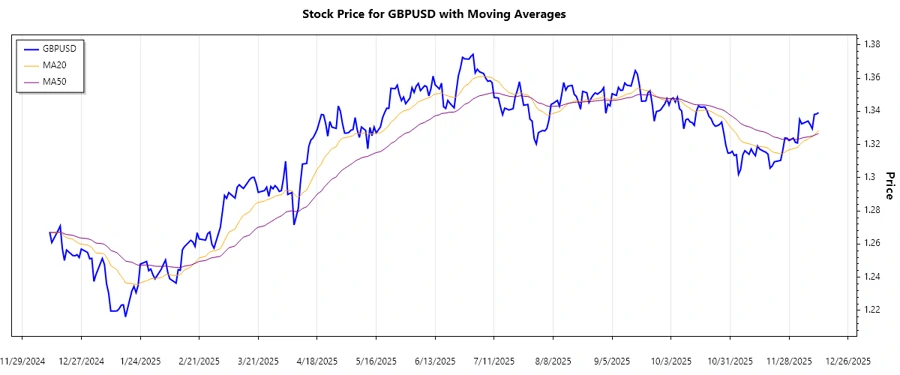
In recent months, the GBPUSD currency pair has experienced significant fluctuations. The pair has shown a strong trend with notable support and resistance levels. Understanding these levels can provide valuable insights for trading opportunities.
Trend Analysis
The GBPUSD currency pair has demonstrated a distinct trend pattern over the previous months. By analyzing the EMA (Exponential Moving Average) calculations, we can see the current market direction. As of the latest data, the EMA20 is higher than the EMA50, indicating an upward trend. This suggests that the currency pair is experiencing bullish momentum.
| Date | Close Price | Trend |
|---|---|---|
| 2025-12-12 | 1.33923 | ▲ Up |
| 2025-12-11 | 1.33833 | ▲ Up |
| 2025-12-10 | 1.33816 | ▲ Up |
| 2025-12-09 | 1.32948 | ▲ Up |
| 2025-12-08 | 1.33209 | ▲ Up |
| 2025-12-07 | 1.33412 | ▲ Up |
| 2025-12-05 | 1.33299 | ▲ Up |
The upward trend in the market suggests investors' confidence in GBP is improving, and traders should watch for potential buying opportunities.
Support and Resistance
Analyzing the price data, we've identified key support and resistance zones for GBPUSD. It's crucial to observe these zones closely as they can indicate potential reversal points. The current market conditions suggest that the price is above the major support levels, reinforcing the upward trend perspective.
| Type | Zone From | Zone To | |
|---|---|---|---|
| Support | 1.3285 | 1.3295 | ▲ Up |
| Support | 1.3200 | 1.3215 | ▲ Up |
| Resistance | 1.3400 | 1.3410 | ▼ Down |
| Resistance | 1.3430 | 1.3440 | ▼ Down |
The current close price is situated in the resistance zone, which might indicate a potential reversal or breakout. Traders should prepare for increased volatility in these areas.
Conclusion
In summary, the GBPUSD shows an overall bullish trend with strong support levels. Investors should capitalize on the current upward momentum while being cautious of approaching resistance zones that may cause pullbacks. Monitoring these technical indicators closely is crucial for effective trading strategies. While there is potential for growth, resistance levels highlight the risk of temporary market corrections.