
October 29, 2026 a 05:08 am
GBPUSD: Fibonacci Analysis
In recent months, the GBPUSD currency pair has exhibited a dominant downward trend, signaling potential bearish sentiments in the market. Various economic factors, including interest rate differentials and geopolitical uncertainties, may have influenced this trend. As investors watch closely, technical analysis tools like Fibonacci retracement can offer insights into potential reversal or continuation points.
Fibonacci Analysis
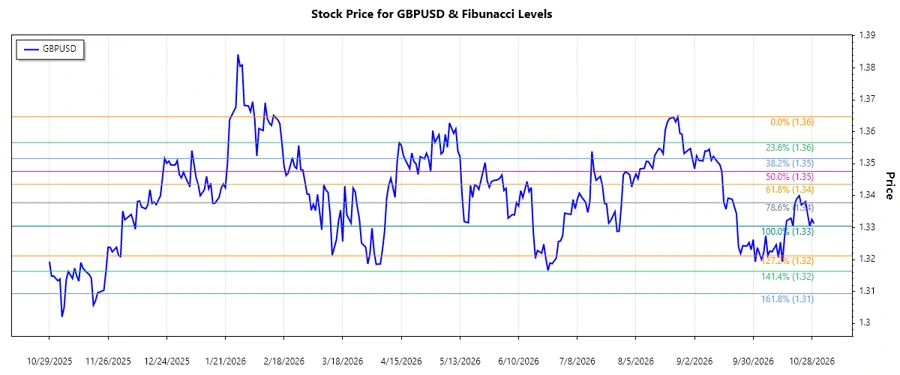
The period analyzed for the recent trend spans from August 25, 2026, to October 25, 2026. During this time, the GBPUSD experienced a bearish trend from a high of 1.36468 on August 25 to a low of 1.33047 on October 27. Analyzing this trend using Fibonacci retracement levels allows us to identify potential areas of support and resistance.
| Fibonacci Level | Price Level |
|---|---|
| 0.236 | 1.33886 |
| 0.382 | 1.34268 |
| 0.5 | 1.34758 |
| 0.618 | 1.35247 |
| 0.786 | 1.36017 |
The current price of GBPUSD is 1.33129, which places it just below the 0.236 retracement level, suggesting that it is out of the retracement zone. This indicates that the market is yet to test the immediate resistance levels post-decline. Technically, this could suggest potential continuous bearish pressure unless a reversal is indicated upon reaching higher Fibonacci levels.
This image illustrates the recent price movement and the Fibonacci retracement levels.
Conclusion
The analysis of GBPUSD shows a consistent downward trend over the recent months. Current pricing below significant Fibonacci levels suggests continued bearish sentiment. However, should the price begin to test these retracement levels, it may signal potential stabilization or even reversal. Analysts should remain vigilant of macroeconomic developments and monetary policy announcements that could swiftly alter the pair's trajectory.
Smart Data Insight
Master the Perfect Entry & Exit for this Stock
Don't leave your profits to chance. Historically, this stock follows specific seasonal patterns that institutional traders use to maximize returns.
- ✅ Identify the "Golden Buying Window"
- ✅ Avoid high-risk correction cycles
- ✅ Backtested data from the last 20+ years