
September 15, 2026 a 05:08 am

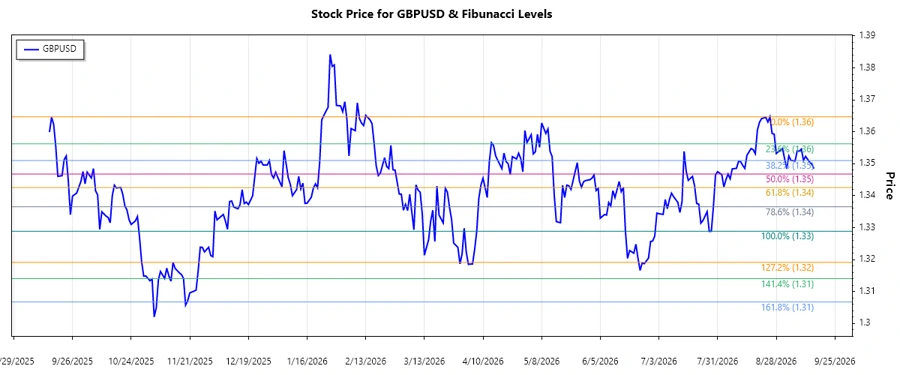
GBPUSD: Fibonacci Analysis
The GBPUSD currency pair has shown notable fluctuations over the past few months. Currently, market sentiment appears to be leaning towards a downward correction after earlier gains. Understanding the potential retracement levels could provide valuable insights for traders looking to capitalize on market movements.
Fibonacci Analysis
The data from mid-July to mid-September 2026 presents a dominant downward trend for the GBPUSD. Key high and low points within this trend have been identified, allowing for the calculation of Fibonacci retracement levels. These levels can be critical in determining potential areas of support or resistance.
| Analysis Details | Data |
|---|---|
| Start Date | 2026-07-27 |
| End Date | 2026-09-15 |
| High Point | 1.36468 (2026-08-25) |
| Low Point | 1.32886 (2026-09-15) |
| Fibonacci Level | Price Level |
|---|---|
| 0.236 | 1.33676 |
| 0.382 | 1.34221 |
| 0.5 | 1.34677 |
| 0.618 | 1.35133 |
| 0.786 | 1.35474 |
Currently, the GBPUSD is positioned around the 1.34847 mark, indicating that it is within the 0.5 Fibonacci retracement level. This suggests a potential support zone, which may lead to a price reversal if confirmed by other indicators.
Conclusion
The Fibonacci retracement analysis has identified key levels that could act as support or resistance for the GBPUSD. While the pair has experienced a decline, the current price residing within the 0.5 retracement level suggests a possible pause in this downtrend. Analysts should be on the lookout for additional signals, such as reversal patterns or volume changes, to confirm any potential price movements. This technical analysis framework may help in formulating strategic decisions regarding entry and exit points in trading.
Smart Data Insight
Master the Perfect Entry & Exit for this Stock
Don't leave your profits to chance. Historically, this stock follows specific seasonal patterns that institutional traders use to maximize returns.
- ✅ Identify the "Golden Buying Window"
- ✅ Avoid high-risk correction cycles
- ✅ Backtested data from the last 20+ years