
August 27, 2026 a 05:08 am

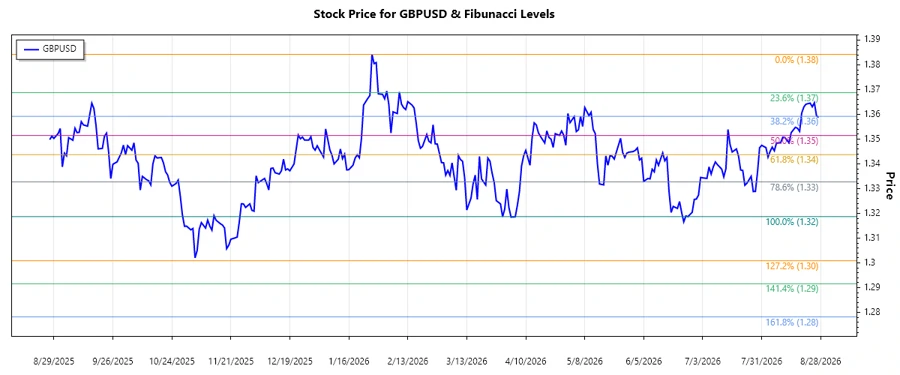
GBPUSD: Fibonacci Analysis
The GBPUSD currency pair has shown significant movements over the analyzed period. The observed trend is determined by a series of lower lows and lower highs, indicating a prevailing downward trend. This trend has been consistent, albeit with minor upward corrections within the broader decline. The recent price behavior suggests some consolidation, allowing for a detailed analysis using Fibonacci retracement levels.
Fibonacci Analysis
The GBPUSD has experienced a prominent downward trend. Using the historical data provided, we identify the high point at 1.38422 on 2026-01-27 and a low point at 1.3187 on 2026-06-26. The Fibonacci retracement levels provide potential zones of support and resistance during retracements.
| Start Date | End Date | High Price | Low Price |
|---|---|---|---|
| 2026-01-27 | 2026-06-26 | 1.38422 (2026-01-27) | 1.3187 (2026-06-26) |
| Fibonacci Level | Price Level |
|---|---|
| 0.236 | 1.33395 |
| 0.382 | 1.34629 |
| 0.5 | 1.35146 |
| 0.618 | 1.35663 |
| 0.786 | 1.37277 |
The current price of GBPUSD stands at 1.35877, placing it just beyond the 0.618 Fibonacci level, suggesting a potential end to the retracement and resumption of the downward trend.
Conclusion: The GBPUSD is in the vicinity of a significant Fibonacci retracement level around 1.35663, which may act as a resistance, indicating the possibility of resuming the prior downtrend.
Conclusion
The GBPUSD currency pair, after a consistent downtrend, appears to be at a critical juncture based on Fibonacci retracement analysis. Should the price not exceed the current resistance, a continued bearish movement is expected. Conversely, a break above may lead to a shift in trend dynamics. Analysts should monitor economic indicators and geopolitical factors that could impact market sentiment and direction. Given the recent price at 1.35877, careful observation is advised around the current resistance levels for potential trading opportunities.
Smart Data Insight
Master the Perfect Entry & Exit for this Stock
Don't leave your profits to chance. Historically, this stock follows specific seasonal patterns that institutional traders use to maximize returns.
- ✅ Identify the "Golden Buying Window"
- ✅ Avoid high-risk correction cycles
- ✅ Backtested data from the last 20+ years