March 02, 2026 a 05:08 am
GBPUSD: Fibonacci Analysis
The GBPUSD currency pair has been showing a dynamic trend over the past few months. It's important to understand the technical levels that are currently influencing this pair. Traders are particularly attentive to the recent price movements as it hints at upcoming market behavior. Careful analysis is required to gauge potential retracement levels that could act as pivotal points for future price movements.
Fibonacci Analysis
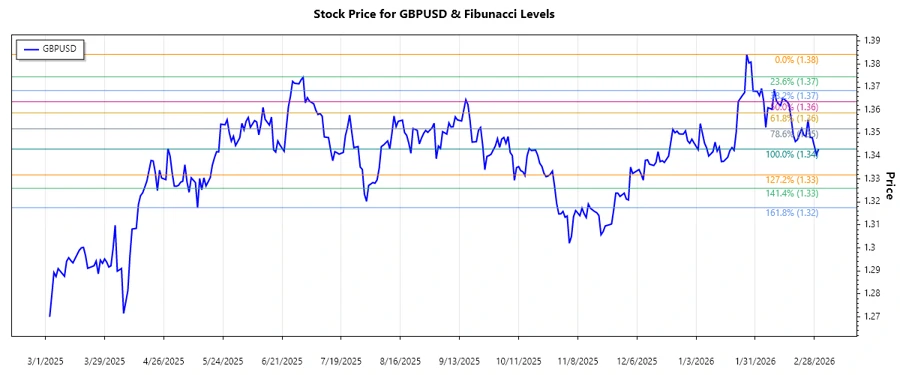
Analyzing the historical data of the GBPUSD reveals a dominant downtrend from January 1, 2026, to March 2, 2026. The high point was observed on January 27, 2026, at a price of 1.38422, while the low point was noted on March 2, 2026, at a price of 1.343.
| Parameter | Details |
|---|---|
| Start Date | 2026-01-01 |
| End Date | 2026-03-02 |
| High Point | 1.38422 (2026-01-27) |
| Low Point | 1.343 (2026-03-02) |
| Fibonacci 0.236 Level | 1.3534 |
| Fibonacci 0.382 Level | 1.3601 |
| Fibonacci 0.5 Level | 1.3646 |
| Fibonacci 0.618 Level | 1.3691 |
| Fibonacci 0.786 Level | 1.3744 |
| Current Price Level | 1.343 (Retracement Zone: None) |
The current price is below the 0.236 Fibonacci level, indicating that it is not within a typical retracement zone. Technically, this suggests potential bearish continuation unless support is found at lower levels.
Conclusion
The GBPUSD pair has been under a consistent downward pressure based on recent data analysis. While it has not entered a retracement zone, cautious monitoring of support levels is key for traders. The potential for a bearish continuation exists, but traders should be alert to any shifts in market sentiment that could alter the course. It's crucial to combine this technical analysis with fundamental insights for a comprehensive view. As always, risk management should be a priority given the currency pair's tendency for volatility.