November 25, 2025 a 05:08 am

GBPUSD: Fibonacci Analysis
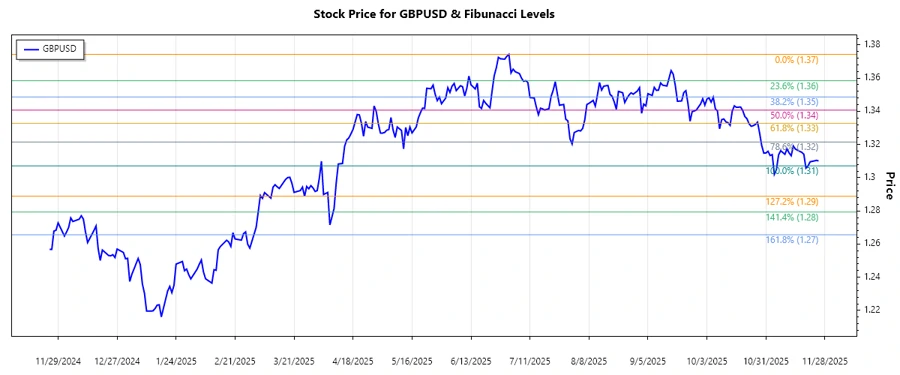
The GBPUSD currency pair has shown a notable downtrend in recent months, primarily dictated by economic uncertainties and geopolitical tensions affecting the UK. Traders have observed this pattern as a reflection of broader market jitters. Against this backdrop, understanding the retracement levels becomes crucial for identifying potential reversal or continuation points in the price movement.
Fibonacci Analysis
| Detail | Value |
|---|---|
| Trend Start Date | 2025-07-01 |
| Trend End Date | 2025-11-25 |
| High Price | 1.37429 on 2025-07-01 |
| Low Price | 1.30711 on 2025-11-20 |
| Fibonacci 0.236 Level | 1.32208 |
| Fibonacci 0.382 Level | 1.33596 |
| Fibonacci 0.500 Level | 1.34070 |
| Fibonacci 0.618 Level | 1.35431 |
| Fibonacci 0.786 Level | 1.35578 |
| Current Price | 1.3101 |
| Retracement Zone | None |
| Interpretation | The current price is beneath the 0.236 Fibonacci retracement level, suggesting that the downtrend might continue unless a significant upward push happens. |
Conclusion
The GBPUSD pair is experiencing a substantial downtrend, and the current price level suggests limited bullish momentum. While the 0.236 Fibonacci level might serve as an initial resistance, further descent is indicated unless market sentiments shift. For analysts, the lack of retracement within higher Fibonacci levels marks potential continuation of the current trend, cautioning short-term traders. However, any positive economic developments could trigger a substantial reversal, offering trading opportunities.
Smart Data Insight
Master the Perfect Entry & Exit for this Stock
Don't leave your profits to chance. Historically, this stock follows specific seasonal patterns that institutional traders use to maximize returns.
- ✅ Identify the "Golden Buying Window"
- ✅ Avoid high-risk correction cycles
- ✅ Backtested data from the last 20+ years