November 01, 2025 a 05:08 am
GBPUSD: Fibonacci Analysis
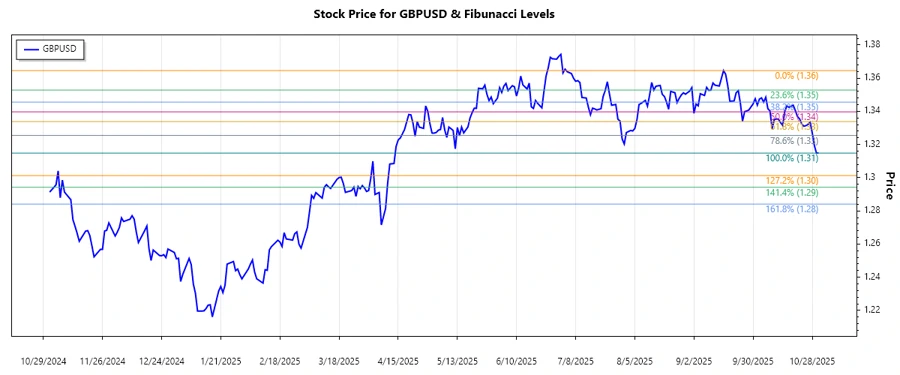
The GBPUSD currency pair has experienced a notable downtrend in recent months. As of late 2025, the pair has been encountering fluctuations influenced by economic data from the United Kingdom and the United States. The downside pressure has been attributed to significant market sentiment surrounding interest rates and inflationary expectations. Technical indicators suggest potential retracement zones that could either reinforce or challenge the prevailing trend.
Fibonacci Analysis
Based on the data provided, the following retracement analysis has been conducted:
| Analysis | Data |
|---|---|
| Trend Start Date | 2025-09-16 |
| Trend End Date | 2025-10-31 |
| High Price (Date) | 1.36453 (2025-09-16) |
| Low Price (Date) | 1.3148 (2025-10-30) |
| Fibonacci Levels | |
| 0.236 | 1.32794 |
| 0.382 | 1.33562 |
| 0.5 | 1.33967 |
| 0.618 | 1.34372 |
| 0.786 | 1.35065 |
| Current Retracement Zone | 0.236 |
| Interpretation | The current price is within the 0.236 retracement level, which suggests a potential rebound zone that could act as support. |
Conclusion
The GBPUSD has been entrenched in a downtrend with identifiable support zones at key Fibonacci levels. Short-term analysis suggests a possible stabilization around the 0.236 retracement level, but macroeconomic influences remain dominant. Analysts should closely monitor any breaks above or below these levels as they may indicate further downside risk or a reversal opportunity. As trading conditions remain volatile, strategic entry and exit points should be based on a composite of technical and fundamental analyses to navigate potential risks and capitalize on identifiable trends.
JSON Output:
Smart Data Insight
Master the Perfect Entry & Exit for this Stock
Don't leave your profits to chance. Historically, this stock follows specific seasonal patterns that institutional traders use to maximize returns.
- ✅ Identify the "Golden Buying Window"
- ✅ Avoid high-risk correction cycles
- ✅ Backtested data from the last 20+ years