September 25, 2025 a 05:08 am

GBPUSD: Fibonacci Analysis
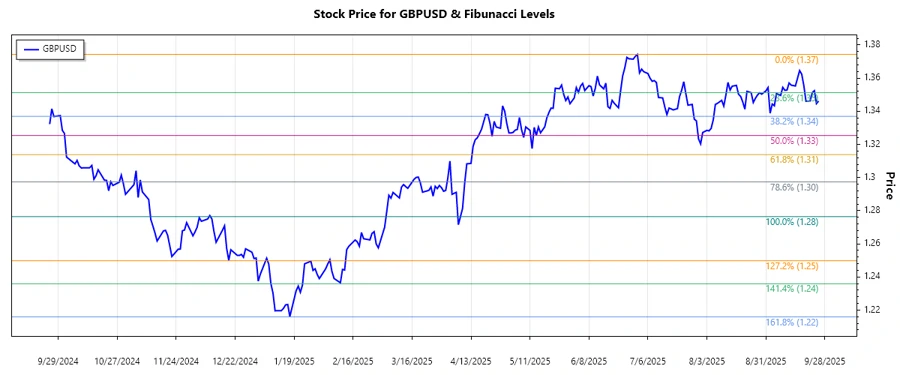
The GBPUSD currency pair has experienced a notable downward trend over the past few months, characterized by fluctuations reflecting economic uncertainties inherent in both the UK and the US economies. These fluctuations underline the potential for further volatility, making technical analysis an essential tool for traders. Understanding these patterns can provide insights into future price movements.
Fibonacci Analysis
| Detail | Information |
|---|---|
| Trend Start Date | 2024-09-26 |
| Trend End Date | 2025-09-25 |
| High Price | 1.37429 (2025-07-01) |
| Low Price | 1.2764 (2025-04-08) |
| 0.236 Retracement | 1.30098 |
| 0.382 Retracement | 1.31754 |
| 0.5 Retracement | 1.32535 |
| 0.618 Retracement | 1.33316 |
| 0.786 Retracement | 1.34741 |
| Current Price and Date | 1.34614 (2025-09-25) |
| Retracement Zone | 0.786 |
| Technical Interpretation | The current price is in the 0.786 retracement zone, which may indicate a potential resistance level, suggesting further analysis is warranted to assess if a reversal or continuation could unfold. |
Conclusion
The analysis of the GBPUSD indicates the currency pair is currently experiencing a retracement, with the price firmly situated within the 0.786 Fibonacci level. This point often acts as a significant resistance and offers a technical indication of potential market behavior. While this level can suggest a reversal, ongoing external economic factors should also be considered for a full assessment. A cautious approach is advised for traders, as this juncture could either act as a pivot for significant reversal or a stepping stone for continuous trends.
Smart Data Insight
Master the Perfect Entry & Exit for this Stock
Don't leave your profits to chance. Historically, this stock follows specific seasonal patterns that institutional traders use to maximize returns.
- ✅ Identify the "Golden Buying Window"
- ✅ Avoid high-risk correction cycles
- ✅ Backtested data from the last 20+ years