September 06, 2025 a 05:08 am
GBPUSD: Fibonacci Analysis
The GBP/USD currency pair has experienced fluctuations influenced by economic policies and global market sentiments. Recent trends highlight its vulnerability to geopolitical shifts and monetary policy adjustments from both the UK and the US. Investors should monitor economic indicators closely, as they can trigger significant price movements in this currency pair.
Fibonacci Analysis
| Analysis Detail | Values |
|---|---|
| Trend Start Date | 2024-11-11 |
| Trend End Date | 2025-09-05 |
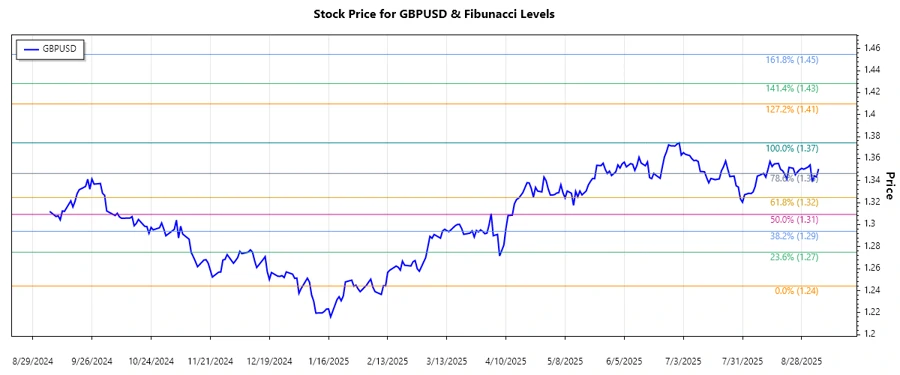
| High Price (Date) | 1.37429 (2025-07-01) |
| Low Price (Date) | 1.24418 (2025-02-12) |
| Fibonacci Level | Price Level |
|---|---|
| 0.236 | 1.27729 |
| 0.382 | 1.30204 |
| 0.5 | 1.30923 |
| 0.618 | 1.32642 |
| 0.786 | 1.35013 |
The current GBPUSD price is within the 0.618 Fibonacci retracement level, suggesting a potential support zone.
This could indicate a bullish reversal if the level holds, offering traders an opportunity for entry with appropriate risk management.
Conclusion
The analysis of GBP/USD reveals potential upside opportunities if current support levels are maintained. However, caution is warranted due to the currency's sensitivity to economic and geopolitical events. The market may exhibit volatility, and traders should consider diversification and risk management strategies. By staying informed about monetary policies and global developments, investors can align their strategies with prevailing trends, optimizing outcomes in the forex market.
Smart Data Insight
Master the Perfect Entry & Exit for this Stock
Don't leave your profits to chance. Historically, this stock follows specific seasonal patterns that institutional traders use to maximize returns.
- ✅ Identify the "Golden Buying Window"
- ✅ Avoid high-risk correction cycles
- ✅ Backtested data from the last 20+ years