August 25, 2025 a 05:08 am

GBPUSD: Fibonacci Analysis
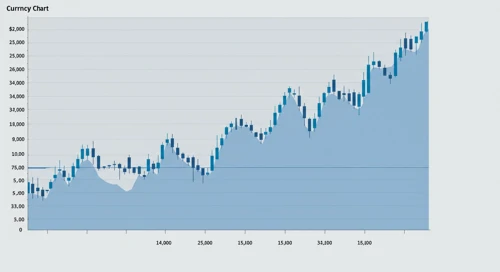
The recent trends in the GBPUSD pair highlight a notable upward movement, especially over the last few months. Despite periods of volatility, the pair has experienced a general increase, driven by various economic factors and global market sentiments. This trend provides opportunities for traders to analyze the GBPUSD's potential retracement levels for future trading strategies.
Fibonacci Analysis
| Parameter | Details |
|---|---|
| Start Date | 2025-04-09 |
| End Date | 2025-08-25 |
| High Price | 1.37429 (2025-07-01) |
| Low Price | 1.28141 (2025-04-09) |
| Fibonacci Level | Price Level |
|---|---|
| 0.236 | 1.30127 |
| 0.382 | 1.31948 |
| 0.5 | 1.32785 |
| 0.618 | 1.33621 |
| 0.786 | 1.34959 |
The current price of 1.35112 lies in the 0.786 retracement zone, indicating potential resistance at this level, suggesting traders could see a reversal or breakout at this price.
Conclusion
The GBPUSD has shown a strong upward trend with key technical levels identified through Fibonacci analysis. While there are opportunities for potential gains, investors should be mindful of possible resistance at the current retracement zone. Strategically, trading near resistance levels requires caution, yet offers potential for lucrative returns for those capitalizing on breakouts or reversals. Analysts should continuously monitor economic indicators and market news that could affect currency strength.
Smart Data Insight
Master the Perfect Entry & Exit for this Stock
Don't leave your profits to chance. Historically, this stock follows specific seasonal patterns that institutional traders use to maximize returns.
- ✅ Identify the "Golden Buying Window"
- ✅ Avoid high-risk correction cycles
- ✅ Backtested data from the last 20+ years