
July 15, 2026 a 04:28 am
GBPSEK: Trend and Support & Resistance Analysis
The GBP to SEK exchange rate has recently shown strong movements, reflecting broader market conditions. Technical analysis reveals vital insights into the currency's trend formations. With calculated EMAs, traders can grasp current impacts and forecast potential developments in GBPSEK.
Trend Analysis
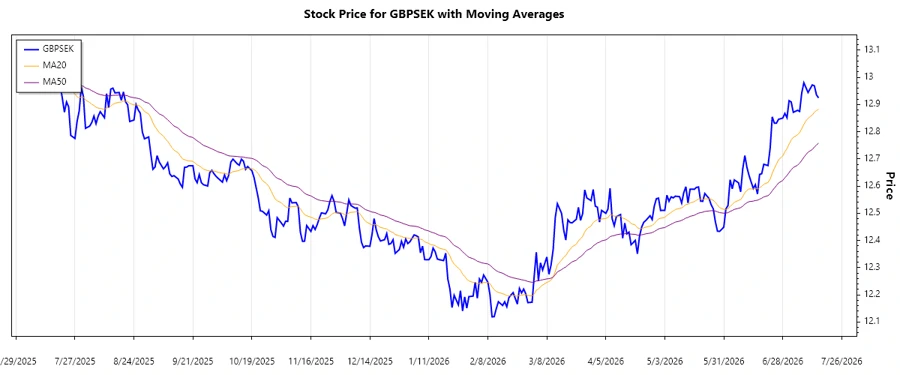
The analysis of the GBPSEK pair over the last several months indicates a significant trend formation. By calculating the EMA20 and EMA50 from the daily closing prices, we observe a notable shift. The consistency where EMA20 surpasses EMA50 highlights a prevailing upward trend.
| Date | Closing Price | Trend |
|---|---|---|
| 2026-07-15 | 12.9244 | ▲ Uptrend |
| 2026-07-14 | 12.9356 | ▲ Uptrend |
| 2026-07-13 | 12.9689 | ▲ Uptrend |
| 2026-07-12 | 12.9721 | ▲ Uptrend |
| 2026-07-10 | 12.9443 | ▲ Uptrend |
| 2026-07-09 | 12.9623 | ▲ Uptrend |
| 2026-07-08 | 12.9803 | ▲ Uptrend |
This upward direction suggests bullish sentiment among traders, foreseeing potential gains ahead. Investing or holding positions in this currency pair might be favorable under current trends.
Support and Resistance
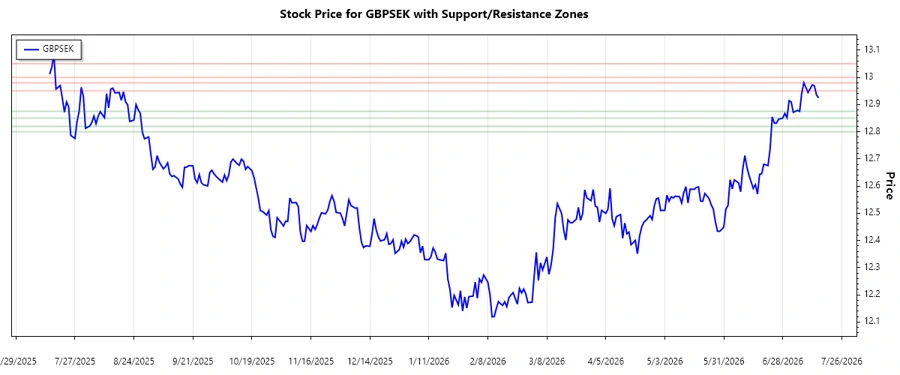
Upon identifying key levels, the GBPSEK shows notable support and resistance zones. These levels are derived from recent price actions and offer traders decision-making markers.
| Type | Zone From | Zone To | Direction |
|---|---|---|---|
| Support | 12.8500 | 12.8750 | ↘️ Lower |
| Support | 12.8000 | 12.8200 | ↘️ Lower |
| Resistance | 13.0000 | 13.0500 | ↗️ Upper |
| Resistance | 12.9500 | 12.9800 | ↗️ Upper |
The current price resides near a resistance zone, hinting at potential price consolidation or reversal. Traders should closely watch if the price breaks beyond the resistance, indicating further upward momentum.
Conclusion
In conclusion, the GBPSEK exchange presents a defined upward trend with well-established support and resistance zones. The dominance of the bullish trend suggests favorability towards continued growth if resistance levels are surpassed. However, traders must remain cautious as current levels approach significant resistance which could lead to brief consolidations or reversals. Careful monitoring and proficient timing could enhance trading opportunities, minimizing risks inherent in currency fluctuations.
Smart Data Insight
Master the Perfect Entry & Exit for this Stock
Don't leave your profits to chance. Historically, this stock follows specific seasonal patterns that institutional traders use to maximize returns.
- ✅ Identify the "Golden Buying Window"
- ✅ Avoid high-risk correction cycles
- ✅ Backtested data from the last 20+ years