January 23, 2026 a 04:28 am


GBPSEK: Trend and Support & Resistance Analysis
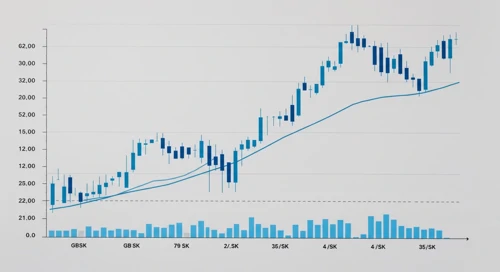
The GBPSEK currency pair has seen fluctuating trends over the past few months. Reflective of various economic conditions influencing both the British pound and Swedish krona, the pair's movements could signal potential trading opportunities. With alternating periods of upward momentum and corrections, understanding the broader trends and key support-resistance zones becomes essential for informed decision-making. As of recent data, the analysis unfolds a clearer picture of ongoing trends that analysts should consider for future strategies.
Trend Analysis
The GBPSEK has shown varied movements recently, influenced by economic and geopolitical factors. Calculating the EMA20 and EMA50 provides insight into these trends. Specifically,:
| Date | Close Price | Trend |
|---|---|---|
| 2026-01-23 | 12.15018 | ▼ Abwärtstrend |
| 2026-01-22 | 12.1528 | ▼ Abwärtstrend |
| 2026-01-21 | 12.2208 | ⚖️ Seitwärtstrend |
| 2026-01-20 | 12.25794 | ⚖️ Seitwärtstrend |
| 2026-01-19 | 12.35328 | ▲ Aufwärtstrend |
| 2026-01-18 | 12.3259 | ▲ Aufwärtstrend |
| 2026-01-16 | 12.3292 | ▲ Aufwärtstrend |
The calculation of moving averages indicates that the GBPSEK pair is in a period of minor fluctuations suggesting a potential stabilization or shift. Market participants should watch for confirmation signs on either upward or downward continuations.
Support- and Resistance
Through examining the price levels, critical support and resistance zones are identified. These levels indicate potential stoppages of the price movements:
| Zone Type | From | To |
|---|---|---|
| Support | 12.15 | 12.20 |
| Support | 12.30 | 12.35 |
| Resistance | 12.35 | 12.40 |
| Resistance | 12.45 | 12.50 |
Currently, the GBPSEK is fluctuating closely to its support zone, showing signs of potential stabilization. Traders should look for either breaks below the support or bounces that could signal continuation patterns.
Conclusion
The GBPSEK has experienced periods of volatility with signs of minor trends forming. The calculated EMAs suggest the current trend is predominantly sideways, with slight leanings towards an uptrend in specific intervals. Key support levels offer potential stabilization zones, while resistance points could limit upward momentum. For analysts, these trends and zones provide vital insights for crafting future strategies, carefully accounting for economic shifts and currency movements. The observed stability hints at consolidation phases, making it prudent for traders to stay updated with potential policy changes and economic releases that might affect the pair.