August 22, 2025 a 04:28 am

GBPSEK: Trend and Support & Resistance Analysis
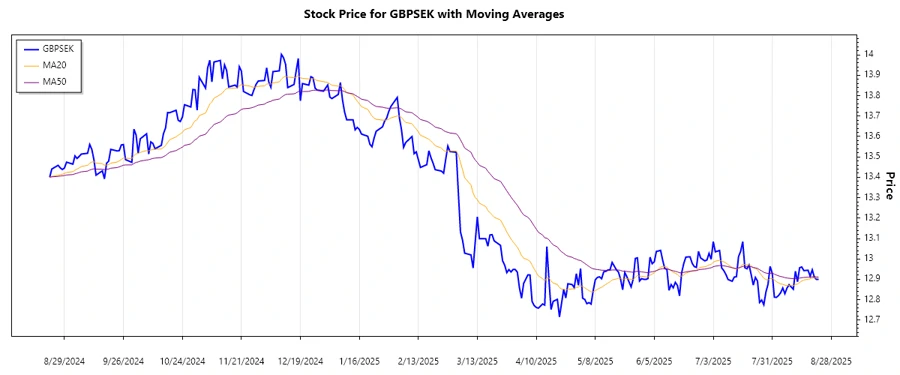
The GBPSEK currency pair has shown fluctuations typical for such exchange rates, with some periods of increased volatility. It is essential to evaluate both short-term and long-term trends to make informed decisions. Support and resistance levels give insights into potential price reversal points. Monitoring the moving averages is also crucial for understanding the overall trend direction.
Trend Analysis
Over recent months, GBPSEK has demonstrated a mixed trend with alternating periods of up and down movements. Calculating the Exponential Moving Averages (EMA), we find that the EMA20 is higher than the EMA50, suggesting a slight upward trend. Here is a detailed view of the last seven days' data, indicating trend direction.
| Date | Closing Price | Trend |
|---|---|---|
| 2025-08-22 | 12.89945 | ▲ Up |
| 2025-08-21 | 12.8993 | ▲ Up |
| 2025-08-20 | 12.9102 | ▲ Up |
| 2025-08-19 | 12.9466 | ▲ Up |
| 2025-08-18 | 12.9154 | ▲ Up |
| 2025-08-17 | 12.9444 | ▲ Up |
| 2025-08-15 | 12.9428 | ▲ Up |
The recent trend indicates a potential continuation of the upward movement, supported by the alignment of moving averages.
Support and Resistance
For GBPSEK, we have identified key support and resistance zones based on historical pricing patterns. The notable support zones and resistance zones are as follows:
| Zone Type | From | To |
|---|---|---|
| Support 1 | 12.81 | 12.83 |
| Support 2 | 12.89 | 12.91 |
| Resistance 1 | 12.95 | 12.97 |
| Resistance 2 | 13.00 | 13.03 |
Currently, the exchange rate is fluctuating within the higher support and resistance zones, indicating potential consolidation.
Conclusion
The analysis of GBPSEK suggests that a cautious upward trend may continue, given that the EMA20 is greater than the EMA50. However, traders should be aware of significant resistance near the 12.97 price level, which may offer short-term resistance to further gains. Support exists in the areas of 12.81 to 12.91, providing potential buying opportunities. The situation requires monitoring for breakout or breakdown cues at these critical levels.
Smart Data Insight
Master the Perfect Entry & Exit for this Stock
Don't leave your profits to chance. Historically, this stock follows specific seasonal patterns that institutional traders use to maximize returns.
- ✅ Identify the "Golden Buying Window"
- ✅ Avoid high-risk correction cycles
- ✅ Backtested data from the last 20+ years