June 25, 2026 a 05:08 am

GBPSEK: Fibonacci Analysis
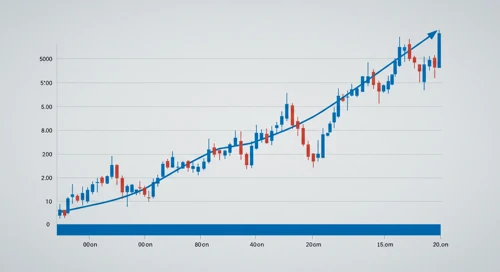
The GBPSEK currency pair has shown significant movement over the past few months. With the British pound affected by political and economic changes, and the Swedish krona's fluctuations driven by regional economic factors, the currency pair has seen a pronounced trend. Understanding these movements is crucial for traders and analysts looking to capitalize on currency shifts.
Fibonacci Analysis
| Information | Details |
|---|---|
| Start Date | 2026-02-09 |
| End Date | 2026-06-25 |
| High Point (Price & Date) | 12.8546 on 2026-06-23 |
| Low Point (Price & Date) | 12.1188 on 2026-02-09 |
| 0.236 Fibonacci Level | 12.3430 |
| 0.382 Fibonacci Level | 12.4865 |
| 0.5 Fibonacci Level | 12.5867 |
| 0.618 Fibonacci Level | 12.6869 |
| 0.786 Fibonacci Level | 12.8084 |
| Current Price | 12.83425 |
| Retracement Zone | 0.786 |
| Technical Interpretation | The GBPSEK is currently within the 0.786 retracement level, indicating a potential resistance that could lead to a reversal or continuation of the trend. Analysts should monitor for consolidation or breakouts at this level. |
Conclusion
As the GBPSEK approaches significant Fibonacci retracement levels, traders must navigate with caution. The current position at the 0.786 retracement level presents both an opportunity and a risk. An upward breakthrough could indicate further gains while a failure to sustain may signal a period of consolidation or reversal. Analysts must stay vigilant, considering both technical signals and macroeconomic factors influencing these currencies.
Smart Data Insight
Master the Perfect Entry & Exit for this Stock
Don't leave your profits to chance. Historically, this stock follows specific seasonal patterns that institutional traders use to maximize returns.
- ✅ Identify the "Golden Buying Window"
- ✅ Avoid high-risk correction cycles
- ✅ Backtested data from the last 20+ years