June 15, 2026 a 05:08 am

GBPSEK: Fibonacci Analysis
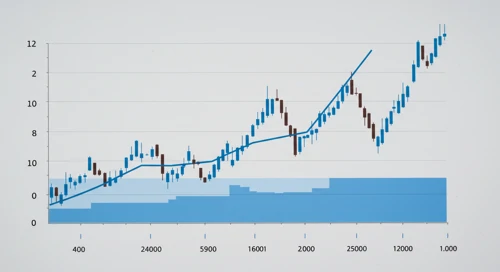
The GBPSEK currency pair has shown mixed movements over the past several months. The current trend analysis reveals an upward trajectory, characterized by a series of higher highs and higher lows. With such movements, traders often seek potential retracement levels to gauge future support and resistance zones.
Fibonacci Analysis
The upward trend for GBPSEK is evident with a notable peak recently. The Fibonacci retracement levels are typically used to identify potential points of interest. Starting from the low point in February 2026 to the high in June 2026, the following retracement levels are calculated:
| Detail | Value |
|---|---|
| Trend Start Date | 2026-02-11 |
| Trend End Date | 2026-06-15 |
| High Point | 12.6418 on 2026-06-13 |
| Low Point | 12.1188 on 2026-02-10 |
Fibonacci Retracement Levels:
| Level | Price |
|---|---|
| 0.236 | 12.2677 |
| 0.382 | 12.3933 |
| 0.5 | 12.4797 |
| 0.618 | 12.5661 |
| 0.786 | 12.6993 |
The current price sit close to the 0.618 retracement level, suggesting potential support in this zone. Technically, this could imply a pullback within an ongoing uptrend. Traders might view this as a buying opportunity, anticipating the resumption of the upward trend.
Conclusion
The GBPSEK upward trend indicates potential bullish momentum in the forex market. As the currency approaches significant Fibonacci retracement levels, careful monitoring is suggested for potential entry points. Risks include unexpected market volatility, which could invalidate current technical setups. Nonetheless, the fibonacci analysis highlights critical price points for traders and analysts.
Smart Data Insight
Master the Perfect Entry & Exit for this Stock
Don't leave your profits to chance. Historically, this stock follows specific seasonal patterns that institutional traders use to maximize returns.
- ✅ Identify the "Golden Buying Window"
- ✅ Avoid high-risk correction cycles
- ✅ Backtested data from the last 20+ years