March 18, 2026 a 05:08 am
GBPSEK: Fibonacci Analysis
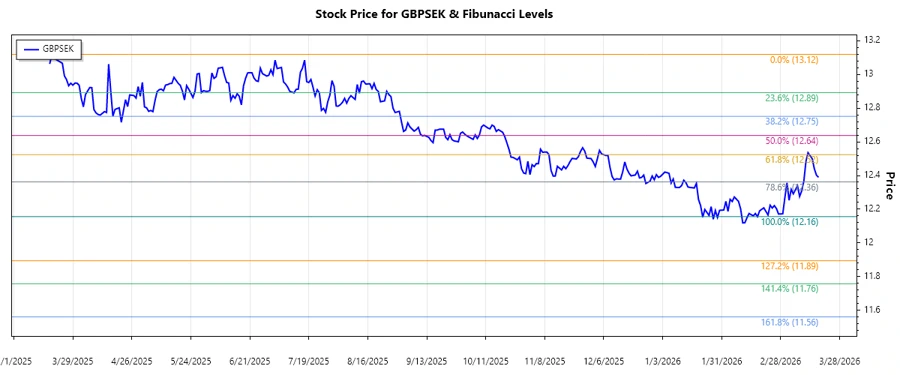
The GBPSEK currency pair has been experiencing significant fluctuations over the past months, with traders keenly observing its movements. Analyzing the trend patterns offers insight into potential future price actions. The recent trend suggests a strengthening of the SEK against the GBP, prompting considerations of strategic entry and exit points based on Fibonacci levels.
Fibonacci Analysis
This analysis focuses on the recent downward trend observed in the GBPSEK currency pair. Key price levels have been identified using Fibonacci retracement to aid in predicting potential support and resistance levels.
| Information | Details |
|---|---|
| Start Date | 2025-03-18 |
| End Date | 2026-03-18 |
| High Price | 13.11874 (2025-03-20) |
| Low Price | 12.156 (2026-02-17) |
Fibonacci Levels
| Level | Price |
|---|---|
| 0.236 | 12.419 |
| 0.382 | 12.587 |
| 0.5 | 12.732 |
| 0.618 | 12.877 |
| 0.786 | 13.066 |
Based on the current price trend, GBPSEK is approaching the 0.236 Fibonacci retracement level. This indicates a potential area of support, which may attract buyers in the near term.
In technical terms, should the price maintain above this level, it could suggest a stabilization or possible reversal trend. However, a breakthrough below this support might indicate further downside potential.
Conclusion
The GBPSEK currency pair has shown a pronounced downward trend, highlighting the strength of the SEK over GBP. With key Fibonacci levels in focus, traders are advised to monitor price actions around these retracement zones closely. While upside recovery attempts may be evident if support holds, risks of further declines linger, especially if critical levels are breached. For analysts, this setup provides both opportunities for profit-taking and risk management, contingent on upcoming market conditions and geopolitical influences.