February 10, 2026 a 05:08 am

GBPSEK: Fibonacci Analysis
The GBPSEK currency pair has shown significant movement within the analyzed timeframe. Recent shifts suggest a dominant downtrend, with Sterling weakening against the Swedish Krona. Economic factors, including Brexit-related concerns and inflation pressures, have impacted the British Pound. Meanwhile, Sweden's economic stability provides a counterbalance, strengthening the SEK.
Fibonacci Analysis
| Attribute | Details |
|---|---|
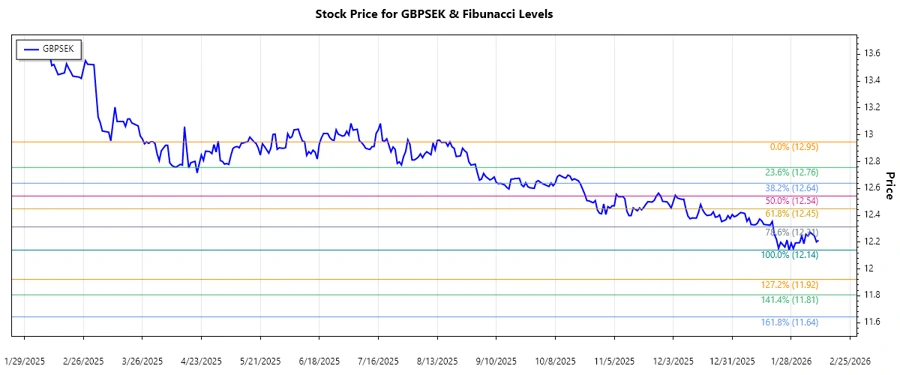
| Trend Dates | 2025-11-18 to 2026-02-10 |
| High Point | 12.9466 on 2025-11-19 |
| Low Point | 12.1404 on 2026-01-27 |
| Fibonacci Level | Price Level |
|---|---|
| 0.236 | 12.3029 |
| 0.382 | 12.4231 |
| 0.5 | 12.5435 |
| 0.618 | 12.6638 |
| 0.786 | 12.804 |
The current price (12.2132) does not fall within any of the standard retracement zones, indicating continued bearish momentum. This suggests potential for further declines unless a reversal occurs.
This technical setup implies resistance around the 0.236 Fibonacci level (12.3029), which can act as a short-term ceiling for any upward attempts.
Conclusion
The GBPSEK has shown a strong downtrend within the analyzed period. With the downtrend likely to continue, GBP faces significant sell-off pressure. Swedish Krona's strength amid this currency pair comprises the primary economic challenge. Investors should be wary of shorting this pair with close attention to global economic reports, which may introduce volatility. Technical resistance at key Fibonacci levels suggests potential short-term pullbacks, primarily at the 0.236 level. Evaluating the currency pair requires a balanced approach, considering both macroeconomic factors and technical indicators to capitalize on potential opportunities.