November 29, 2025 a 05:08 am

GBPSEK: Fibonacci Analysis
The GBPSEK currency pair has shown significant fluctuations in recent months. With the economic uncertainties surrounding Brexit and the Riksbank's monetary policy in Sweden, traders are keeping a close watch on this volatile pair. An in-depth technical analysis reveals key support and resistance levels that could inform future trading decisions.
Fibonacci Analysis
| Attribute | Value |
|---|---|
| Start Date | 2024-12-10 |
| End Date | 2025-11-28 |
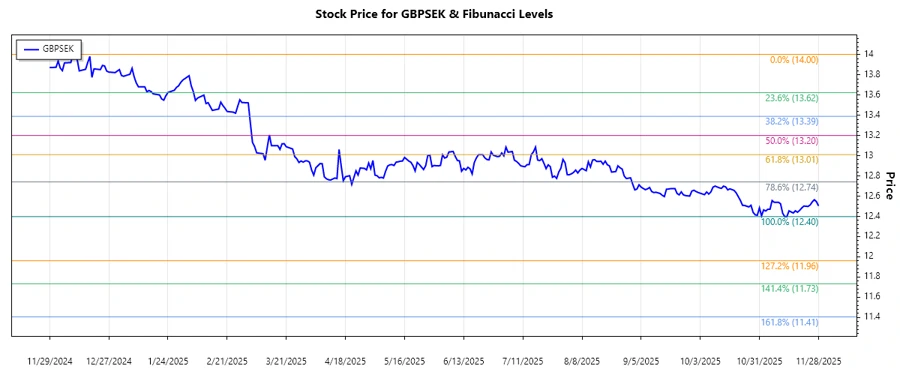
| High Point | 14.00196 (2024-12-10) |
| Low Point | 12.3972 (2025-11-13) |
| Fibonacci Level | Price Level |
|---|---|
| 0.236 | 12.7503 |
| 0.382 | 12.9861 |
| 0.500 | 13.1996 |
| 0.618 | 13.4131 |
| 0.786 | 13.7295 |
The current price of 12.5032 is within the 0.236 Fibonacci retracement zone, suggesting potential resistance at this level.
Technically, this indicates that the current bearish trend may encounter some support at this retracement level, potentially triggering a reversal or consolidation phase.
Conclusion
In conclusion, the GBPSEK currency pair has experienced a notable downward trend over the analyzed period. Fibonacci retracement analysis indicates key price levels that could act as potential support or resistance. While the economic landscape remains uncertain, these technical levels provide potential opportunities for traders to capitalize on potential price movements. However, caution is advised as geopolitical factors and central bank decisions could lead to unexpected volatility.