October 29, 2025 a 05:08 am
GBPSEK: Fibonacci Analysis
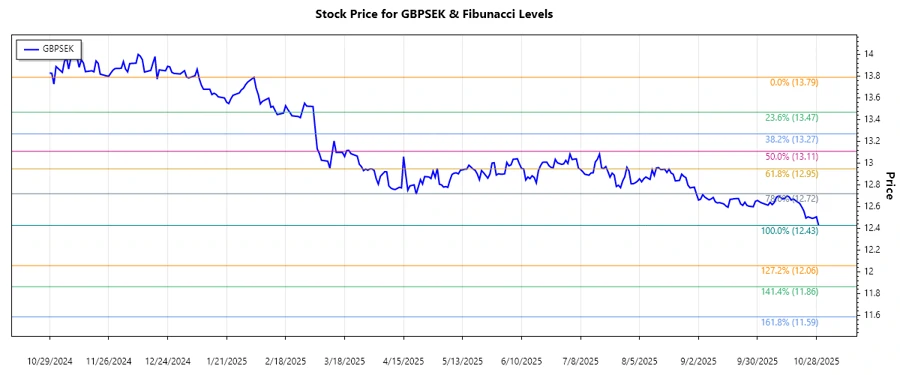
Over the past few months, GBPSEK has demonstrated fluctuating dynamics, reflecting geopolitics and macroeconomic forces between the UK and Sweden. The data reveals a notable trend that provides critical insights for traders looking to leverage exchange rate movements.
Fibonacci Analysis
| Detail | Value |
|---|---|
| Start Date | 2025-02-03 |
| End Date | 2025-10-29 |
| High Point | 13.79106 (2025-02-03) |
| Low Point | 12.4288 (2025-10-29) |
Fibonacci Levels
| Level | Price |
|---|---|
| 0.236 | 12.6913 |
| 0.382 | 12.8923 |
| 0.5 | 13.1099 |
| 0.618 | 13.3274 |
| 0.786 | 13.6007 |
The current price is within the 0.382 retracement zone, suggesting this area might act as a resistance level.
Currently, the price is technical testing a possible resistance. If it holds, we might see a reversal; a break above could indicate a continued retracement to higher fib levels.
Conclusion
The GBPSEK has been in a corrective downward trend but currently shows signs of consolidation around Fib level 0.382. Analysts see potential for either a rebound caused by fundamental drivers or a break to lower grounds if economic pressures persist. Trading within such retracement zones offers opportunities, but caution is due as external factors can sway movements rapidly.
Smart Data Insight
Master the Perfect Entry & Exit for this Stock
Don't leave your profits to chance. Historically, this stock follows specific seasonal patterns that institutional traders use to maximize returns.
- ✅ Identify the "Golden Buying Window"
- ✅ Avoid high-risk correction cycles
- ✅ Backtested data from the last 20+ years