October 03, 2025 a 05:08 am
GBPSEK: Fibonacci Analysis
The GBPSEK currency pair has exhibited noticeable volatility over the analyzed period, reflecting the broader economic narratives surrounding both the UK and Sweden. Economists continue to monitor how macroeconomic factors influence this pair. With recent fluctuations, understanding technical levels could offer potential insights into future movements.
Fibonacci Analysis
| Parameter | Value |
|---|---|
| Start Date | 2025-01-03 |
| End Date | 2025-09-30 |
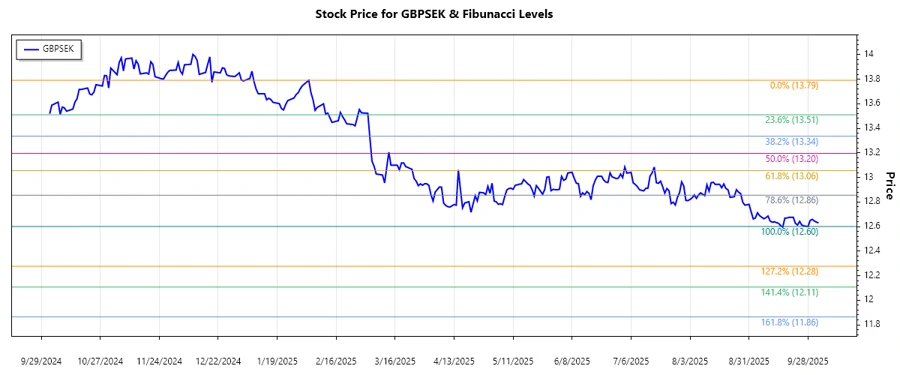
| High Price | 13.79106 on 2025-02-03 |
| Low Price | 12.60023 on 2025-09-28 |
| Fibonacci Level | Price Level |
|---|---|
| 0.236 | 12.88192 |
| 0.382 | 13.05118 |
| 0.5 | 13.19565 |
| 0.618 | 13.34012 |
| 0.786 | 13.54795 |
As of the latest data, the current price falls within the 0.236 retracement level, suggesting a potential temporary support in the downtrend. Hence, traders should be cautious of potential rebounds at this level, while anticipating further potential declines if broken.
Conclusion
The GBPSEK exhibits a pronounced downtrend over the observed period, with Fibonacci levels providing strategic insights into potential support and resistance zones. The currency pair's current positioning at the 0.236 level may offer a temporary reprieve for traders observing potential rebounds. However, the overarching downtrend signifies vigilance, with prospects for further depreciation should crucial levels fail to hold. Analysts should remain attentive to external economic influences that could further alter trajectory potentialities.
Smart Data Insight
Master the Perfect Entry & Exit for this Stock
Don't leave your profits to chance. Historically, this stock follows specific seasonal patterns that institutional traders use to maximize returns.
- ✅ Identify the "Golden Buying Window"
- ✅ Avoid high-risk correction cycles
- ✅ Backtested data from the last 20+ years