August 14, 2025 a 05:08 am
GBPSEK: Fibonacci Analysis
The GBPSEK currency pair has shown significant movement over the past months. With fluctuating market conditions, understanding key levels for this currency is crucial for traders. Recent data analysis indicates a dominant downtrend, presenting potential buying opportunities upon reversals or breaks of major resistance levels.
Fibonacci Analysis
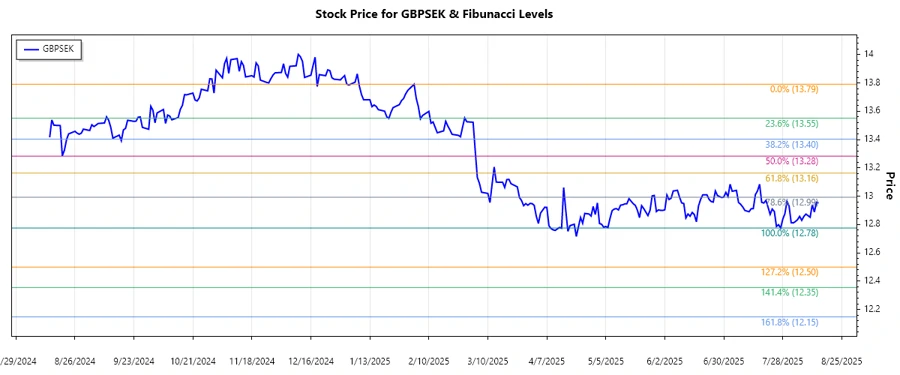
Upon analyzing the last few months of GBPSEK data, a clear downtrend was identified. The high during this period reached 13.79106 on January 3, 2025, and the low was observed at 12.7752 on July 27, 2025. Using these values, the Fibonacci retracement levels have been calculated to give potential reversal zones.
| Description | Value |
|---|---|
| Trend Start Date | 2024-12-24 |
| Trend End Date | 2025-07-28 |
| High Price | 13.79106 (2025-01-03) |
| Low Price | 12.7752 (2025-07-27) |
| Fibonacci 23.6% | 13.0738 |
| Fibonacci 38.2% | 13.1730 |
| Fibonacci 50% | 13.2831 |
| Fibonacci 61.8% | 13.3932 |
| Fibonacci 78.6% | 13.5405 |
The current price of 12.95195 is not within any of the retracement areas. Should the price rise to the 23.6% retracement level or above, traders might see potential indicators of trend reversal or continuation.
This analysis technically suggests that, while the downtrend persists, any upward movement through these levels could encounter resistance, offering possible sell or short positions.
Conclusion
The Fibonacci analysis provides traders with critical insight into potential key support and resistance levels for GBPSEK. While the pair is trending downward, breaking significant Fibonacci levels may indicate trend shifts. Traders must be cautious of false breakouts and ensure risk management strategies are in place. Overall, GBPSEK remains a currency pair with opportunities for well-timed entries in expected volatility scenarios.
Smart Data Insight
Master the Perfect Entry & Exit for this Stock
Don't leave your profits to chance. Historically, this stock follows specific seasonal patterns that institutional traders use to maximize returns.
- ✅ Identify the "Golden Buying Window"
- ✅ Avoid high-risk correction cycles
- ✅ Backtested data from the last 20+ years