
July 19, 2026 a 04:28 am
GBPNZD: Trend and Support & Resistance Analysis
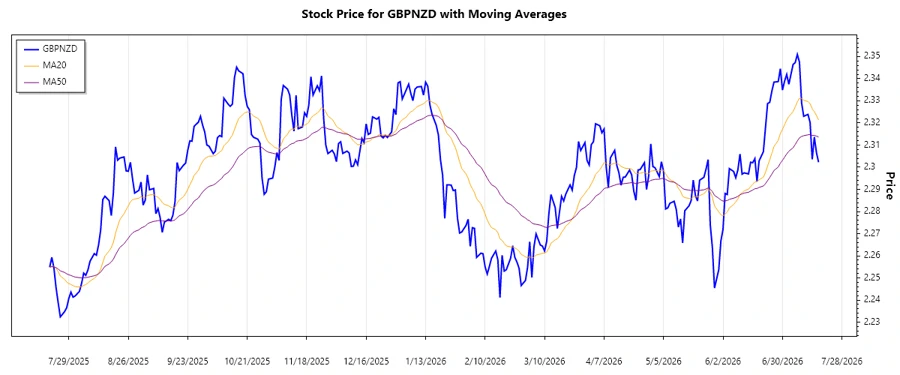
The GBPNZD exchange rate has experienced some notable movements over the recent months. Based on the trend analysis, market conditions hint at a possible continuation of the prevailing momentum. Traders should take note of crucial support and resistance levels that could further influence trading actions. As with any currency pair, global economic indicators and geopolitical events may play pivotal roles in future price movements.
Trend Analysis
| Date | Closing Price | Trend |
|---|---|---|
| 2026-07-17 | 2.30226 | ⚖️ |
| 2026-07-16 | 2.30661 | ⚖️ |
| 2026-07-15 | 2.31368 | ▲ |
| 2026-07-14 | 2.3036 | ▼ |
| 2026-07-13 | 2.32021 | ▲ |
| 2026-07-12 | 2.32387 | ▲ |
| 2026-07-10 | 2.32302 | ▲ |
The GBPNZD has shown signs of a stable upward momentum, which could suggest potential bullish market behavior in the coming days.
Support and Resistance
| Zone Type | From | To |
|---|---|---|
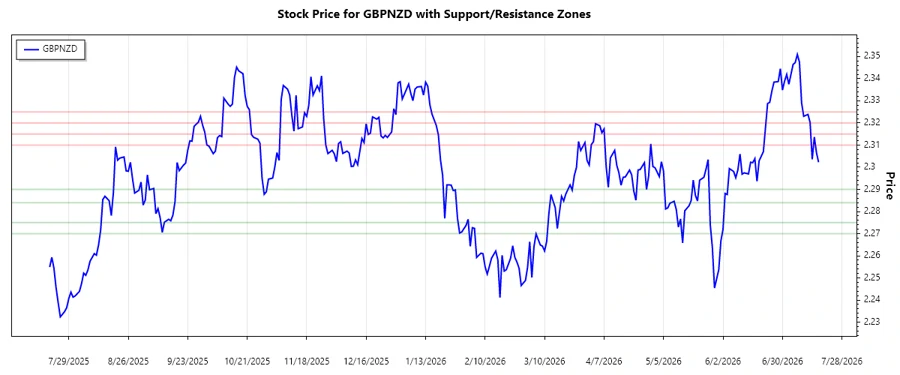
| Support-1 | 2.284 | 2.290 |
| Support-2 | 2.270 | 2.275 |
| Resistance-1 | 2.310 | 2.315 |
| Resistance-2 | 2.320 | 2.325 |
The current price is approaching a resistance zone, which might test the bullish trend if breached.
Conclusion
The GBPNZD exchange rate displays a moderate upward trend, with key support and resistance levels identified. The positioning of the current price relative to these zones suggests potential bullish market activity if resistance levels are significantly breached. However, traders must remain vigilant to potential volatility, influenced by economic and geopolitical factors. This period is critical for charting future market directions, providing both opportunities and risks for traders and analysts alike.
Smart Data Insight
Master the Perfect Entry & Exit for this Stock
Don't leave your profits to chance. Historically, this stock follows specific seasonal patterns that institutional traders use to maximize returns.
- ✅ Identify the "Golden Buying Window"
- ✅ Avoid high-risk correction cycles
- ✅ Backtested data from the last 20+ years