June 15, 2026 a 04:28 am
GBPNZD: Trend and Support & Resistance Analysis
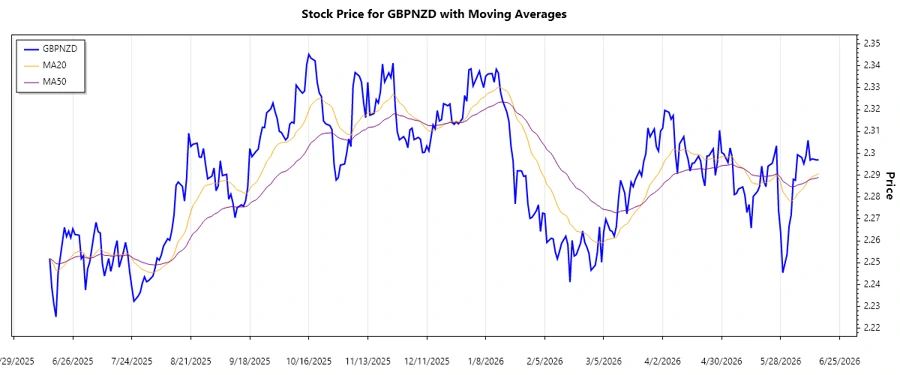
The GBPNZD exchange rate shows varying patterns over the past months. With a mix of upward and downward movements, the market sentiment fluctuates significantly. The EMA20 and EMA50 indicators provide vital insights into the current trend direction. As global economic conditions affect currency values, traders should stay vigilant for any rapid changes. Understanding support and resistance zones is crucial for setting strategic trade positions.
Trend Analysis
The analysis of the GBPNZD exchange rate over the given period indicates fluctuating trends. Calculating the EMA20 and EMA50 reveals the nature of the trend. Over the last seven days:
| Date | Closing Price | Trend |
|---|---|---|
| 2026-06-15 | 2.297 | ▼ |
| 2026-06-14 | 2.29698 | ▲ |
| 2026-06-12 | 2.29747 | ▲ |
| 2026-06-11 | 2.29688 | ▼ |
| 2026-06-10 | 2.30595 | ▲ |
| 2026-06-09 | 2.29879 | ▼ |
| 2026-06-08 | 2.29523 | ▼ |
The recent data shows mixed signals with alternating up and down movements. The EMA calculations suggest a minor downward trend due to more down movements in the given week. Technical interpretation points to the necessity of observing further developments before confirming a trend direction.
Support- and Resistance
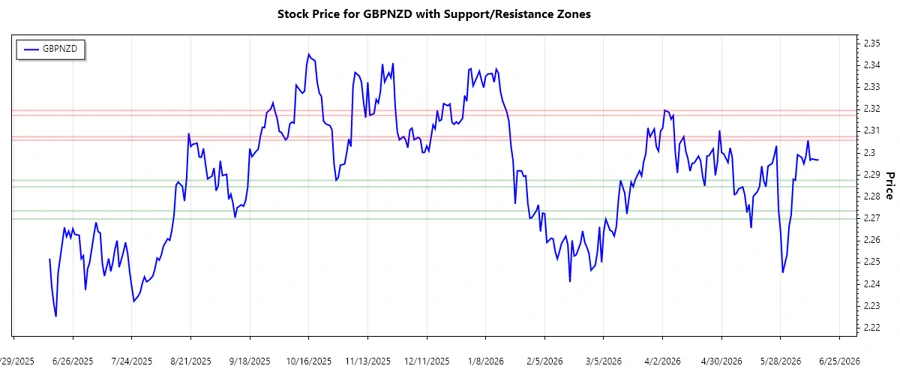
Analyzing the data for key support and resistance zones reveals significant price barriers. Calculations show:
| Zone Type | From | To |
|---|---|---|
| Support | 2.28475 | 2.28767 |
| Support | 2.27000 | 2.27369 |
| Resistance | 2.30595 | 2.30765 |
| Resistance | 2.31727 | 2.31965 |
Currently, the price resides near the upper support zone reflecting potential buying interest around 2.287. Technically, this suggests potential upward momentum if the support holds. However, breaking this zone may introduce new dynamics.
Conclusion
The analysis of GBPNZD reflects a slightly bearish sentiment in the current period, with defined support and resistance levels preventing sharp declines. While support zones provide buying opportunities, resistance zones challenge upward movements. Traders should carefully consider these levels to plan their strategies. The market remains sensitive to global economic influences; therefore, vigilant monitoring and quick responsiveness are key to navigating these trends.
Smart Data Insight
Master the Perfect Entry & Exit for this Stock
Don't leave your profits to chance. Historically, this stock follows specific seasonal patterns that institutional traders use to maximize returns.
- ✅ Identify the "Golden Buying Window"
- ✅ Avoid high-risk correction cycles
- ✅ Backtested data from the last 20+ years