May 15, 2026 a 04:28 am
GBPNZD: Trend and Support & Resistance Analysis
The GBPNZD currency pair has experienced noticeable fluctuations recently. Analyzing recent trends, technical indicators suggest mixed signals, with potential for both upward and downward movements. Evaluating support and resistance levels can further guide the next possible price actions.
Trend Analysis
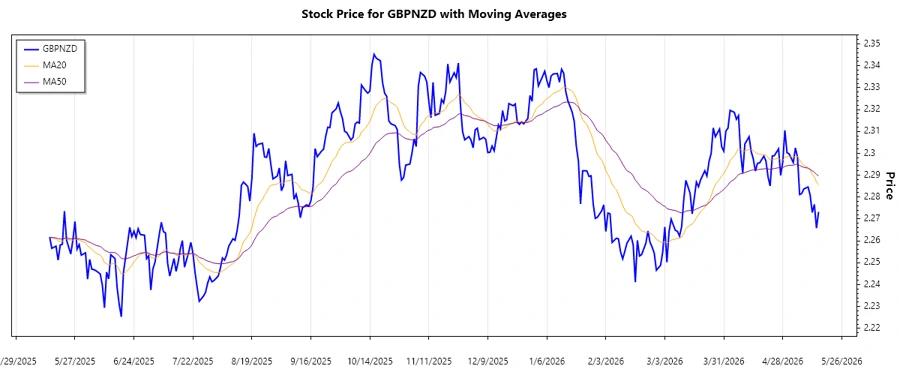
Analyzing the GBPNZD over the last few months indicates a varied trend pattern. The recent days have shown slight fluctuations around a median value. Calculating based on the moving averages, the EMA20 and EMA50 provide insight into the trend direction.
| Date | Close Price | Trend |
|---|---|---|
| 15-May-2026 | 2.27322 | ▲ (upward) |
| 14-May-2026 | 2.2658 | ▲ (upward) |
| 13-May-2026 | 2.27666 | ▲ (upward) |
| 12-May-2026 | 2.27298 | ▲ (upward) |
| 11-May-2026 | 2.28087 | ▲ (upward) |
| 10-May-2026 | 2.28463 | ▲ (upward) |
| 08-May-2026 | 2.28373 | ▲ (upward) |
With EMA20 rising above EMA50 consistently in the past week, an upward trend is indicated, suggesting potential bullish momentum.
Support- and Resistance
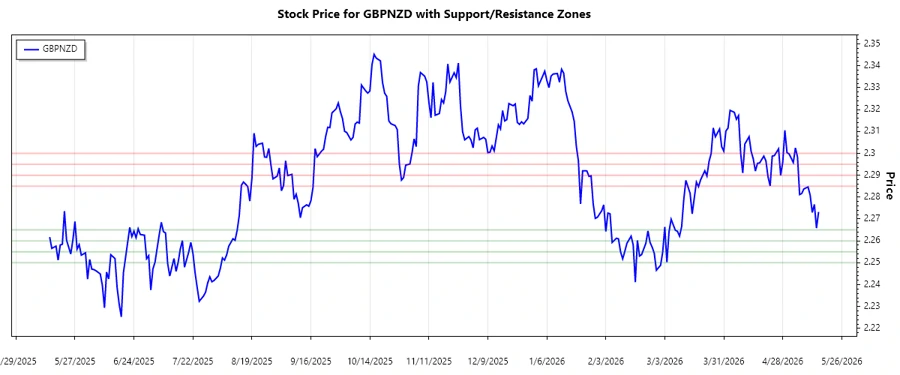
The market dynamics around support and resistance levels are crucial in predicting potential reversals or continuations. Based on the historical data, several zones have been identified below:
| Type | Zone (From) | Zone (To) |
|---|---|---|
| Support 1 | 2.2600 | 2.2650 |
| Support 2 | 2.2500 | 2.2550 |
| Resistance 1 | 2.2850 | 2.2900 |
| Resistance 2 | 2.2950 | 2.3000 |
The current price is in proximity to the first resistance zone, suggesting potential upside limitation if unable to break through.
Conclusion
In conclusion, the GBPNZD is displaying an upward trajectory, although it approaches significant resistance levels. Short-term opportunities exist for bullish investors, yet caution is advised. The resistance zones identified could pose challenges unless breached, defining pivotal points for potential trend reversals or consolidations.
Smart Data Insight
Master the Perfect Entry & Exit for this Stock
Don't leave your profits to chance. Historically, this stock follows specific seasonal patterns that institutional traders use to maximize returns.
- ✅ Identify the "Golden Buying Window"
- ✅ Avoid high-risk correction cycles
- ✅ Backtested data from the last 20+ years